-
AGRI-FOOD SYSTEMS
SYSTEM DRIVERS
Demographics and development


By 2050, over 2.1 billion people will live in sub-Saharan Africa, which is larger than the population of both China and India as well as Europe, Latin America, and the U.S.
The population of sub-Saharan Africa, currently only about 80 % that of China and India, is expected to increase exponentially over the coming decades.
Total population growth is a mega-trend that affects many aspects of agri-food systems.
Additional info
Population growth trends will play an outsized role in agri-food systems – not only do population dynamics shape labor markets and food consumption trends, but the population of sub-Saharan Africa is expected to change rapidly by 2050, which has the potential to cause large-scale changes across the AFS.
This figure represents historic trends and forward-looking medium-fertility population projections from the UN Population Prospects dataset. While most other global regions of note have seen populations plateau over the past 20 years, sub-Saharan Africa has been on a constant upward trajectory. The current population of the region is over 1 billion people and is expected to nearly double to just over 2 billion by 2050. Comparatively, China and India’s population growth is expected to plateau, and eventually begin declining beyond 2050. Latin America and the United States expect modest growth by 2050, and Europe is projected to experience mild population contraction.
As other figures illustrate, sub-regions within sub-Saharan Africa will differ in the rate at which urban and rural populations will grow, as growth patterns are affected by both present and future conditions. These uncertainties make it difficult to predict precisely how sub-Saharan Africa’s explosive population growth will affect the AFS. However, taken together, the projections here suggest that sub-Saharan Africa will be the most populous region in the world by 2050. This growing population’s demand for food and available labor for AFS jobs brings the potential to transform how AFS function both within sub-Saharan Africa, as well as within other regions with extensive trade ties to sub-Saharan Africa.

- The youth population is expected to grow and urbanize at different rates across regions in sub-Saharan Africa.
- Eastern and Western Africa are expected to see the largest growth in youth populations by 2050.
- The majority of youth in Southern Africa, Western Africa, and Central Africa will live in urban areas by 2050.
Additional info
Youth demand for AFS employment will be highly influenced by the spatial distribution of youth. According to Shared Socioeconomic Pathways (SSP) projections models produced for the Intergovernmental Panel on Climate Change (IPCC), most regions within sub-Saharan Africa will have a primarily urban youth population. By 2050, the urban share of Eastern African youth is anticipated to reach 45%.
Overall, the largest growth in youth population will be in Eastern and Western Africa, while Central Africa will see modest growth and Southern Africa will remain flat. These regions will differ in expected spatial distribution of youth. By 2050, the majority of youth in Western, Central, and South Africa will live in cities, while a small and narrowing majority of Eastern African youth will continue to reside in rural areas as they do today.
The implication of this trend is that more Eastern African youth will seek AFS employment in agriculture or other rural-centered food jobs such as aggregation and transportation, given that these sectors are concentrated in rural areas. The more highly urbanized youth in Western, Central, and Southern Africa may be more likely to find AFS employment in food manufacturing, distribution, and service industry jobs. The population growth and urbanization models represented in these figures are based on an SSP-2 scenario, which assumes moderate challenges to climate change adaptation and mitigation . Adaptation refers to actions taken to improve resilience to the effects of climate change (e.g., planting mangroves in coastal areas), while mitigation refers to actions taken to reduce contributions to climate change (e.g., curbing greenhouse gas emissions). Moderate challenges to adaptation and mitigation implies political or economic barriers to taking action at the national-, regional-, or global-levels.
Consumption

- Food supply has remained relatively constant at the subregion-level from 2010 to present.
- Over this period, Eastern Africa has had the lowest overall average food supply (~2,500 g/capita/day) while Central and Western Africa’s food supply neared 3,500 g/capita/day.
- Southern Africa had the highest per-capita supply of animal products, while Central and Western Africa had the highest per-capita supply of vegetable oil and vegetables, fruits, and nuts.
Additional info
Food supply is defined as the amount of food available for consumption by people on an annual basis and is calculated by adding food produced with food imported, and subtracting food exported. Because reliable annual and national-level records of food consumption are not often available, food supply is an important indicator of potential food consumption patterns. Food supply also relates to economic growth; high income county populations tend to consume more animal products and processed foods.
Between the years 2010 and 2020, food supply patterns across sub-Saharan Africa were relatively stable. By the end of the decade, Central and Southern Africa had a slight reduction in overall food consumed, while Eastern Africa had a slight uptick of overall food supply. Central and Western Africa have similar food supply profiles – in both sub-regions, the largest share of food supply comes from fruits, vegetables, and nuts, with cereals and vegetable oil playing important roles as well. Eastern Africa, on the other hand, had an even split between cereals and vegetables, fruit, and nuts, with animal products and vegetable oil representing smaller but important portions of food supply. In contrast, Southern African countries’ food supply is primarily made up of cereals and animal products, with a smaller portion coming from vegetables, fruits, and nuts and vegetable oil.
Technology

- Across African countries surveyed, urban areas have higher mobile money account ownership. Within countries, this difference is often 10 percentage points or more.
- There are not consistent differences between youth (15-24) and non-youth (25+) across reporting countries; in some, youth are more likely to possess a mobile money account, and in other countries are less likely.
- Excluding Kenya, the overall percentage of mobile money account ownership among youth is low.
Additional info
Since it was first introduced nearly 20 years ago, mobile money has become one of the most important technologies in building a more inclusive and connected economy in sub-Saharan Africa. Mobile money enables people with a cell phone to pay for products and services or to receive payments remotely.
Among 15-24-year-olds, mobile money account ownership has increased from between 5-20% in 2014 to between 20-30% in 2021. For people aged 25-years-old and above, membership has grown from between 5-25% in 2014 to up to 40% in 2021. However, mobile money account ownership tends to be highly stratified by urban/rural setting. In many countries, the gap between the percentage of urban and rural households with at least one mobile money accounts is 10% or higher. However, in Kenya, Uganda, Ghana, and Zimbabwe, ownership among rural households is higher than among urban residents in most other countries.
Mobile money accounts are a heuristic for connectedness along value chains and readiness for innovation. For example, an agro-processing entrepreneur in a country with a high rate of mobile money penetration will be able to work with farmers fairly easily to establish a secure supply of crops for a new product. Comparatively, a similar entrepreneur in a country with low mobile money ownership will need to establish a cash-based business in order to develop a new line of business.

- Southern Africa had the highest fixed broadband subscription rate in 2022, growing consistently since 2005 but still low at 3 per 100 people.
- Other sub-regions in sub-Saharan Africa have experienced limited growth in fixed broadband subscriptions, with sub-regional averages each at fewer than 1 subscriber per 100 people.
Additional info
Similar to mobile money accounts, internet access is an important indicator of economic connectedness. Higher rates of internet connections indicate greater access to information, which may translate to agri-food systems transformations vis-à-vis greater educational and economic opportunities, and growth. Additionally, many innovations for precision agriculture and higher-tech agro-processing rely on internet-based technologies.
Across sub-Saharan Africa, broadband subscriptions are low compared to the global average. Broadband access is highest in Southern Africa, at approximately three subscriptions per 100 people. Eastern, Central, and Western Africa are all below one subscription per 100 people, though this has been trending upward in the past decade. This trend indicates that technological transformations of agri-food systems are not becoming rapidly wide-spread, even as mobile-based technologies such as mobile money are transforming entrepreneurship.
Markets

- Western and Eastern Africa report the largest value of cash crop exports from sub-Saharan Africa. Those two sub-regions, along with Southern Africa, report the lion’s share of non-cash crop exports.
- In contrast, Central Africa accounts for very little of the export value from sub-Saharan Africa.
- Between 2000 and 2020, the value of cash crop exports increased threefold and the value of non-cash crop exports increased fivefold and continues to rise.
- “Other agricultural products” include animal products, processed and unprocessed cereals, vegetables, fruits, and nuts, pulses, vegetable oils, and other products which are not cash crops.
Additional info
In 2000, the value of cash crop exports from all of sub-Saharan Africa was below $5 billion annually. In 2021, Eastern Africa exported approximately $5 billion and Western Africa exported nearly $10 billion in cash crops. This aligns with the popular understanding of where cash crops – such as cocoa, coffee, and vanilla – are grown on the continent. Central and Southern Africa have seen slight increases in cash crop exports between 2000 and today, but these increases are minimal compared to the massive growth seen in Eastern and Western Africa and represent only about $1 billion or less per year.
The value of non-cash crop exports has increased to an even greater degree than cash crop exports since 2000. In 2000, the value of non-cash crop exports was less than $5 billion combined across sub-regions; in 2021, Eastern, Western, and Southern Africa exported a combined $25 billion in non-cash crop agricultural products. Meanwhile, Central Africa non-cash crop exports have barely changed.
This growth in the value of agricultural exports indicates that Eastern, Western, and Southern Africa are increasingly interacting with and supplying goods to global agri-food systems. Demand for African cash crops and other agricultural exports may drive AFS labor in terms of which crops need to be grown or which value-added products must be produced for export.

- The largest share of intra-African trade take place between countries in the same region – for example, from one country in Southern Africa to another country in Southern Africa.
- Trade within and between regions has increased steadily over time.
- The most commonly traded items are processed agricultural products, animal products, and other processed goods.
Additional info
Linkages between neighboring countries and sub-regions in sub-Saharan Africa has the potential to influence agricultural production, as well as employment in other sectors of the AFS focused on packaging and transporting products for intra-continental trade. Between 2000 and 2023, there has overall been a steady increase in intra-African trade, with some variation along the way. One hallmark of intra-African trade is that most trade occurs between countries in the same region.
Since 2000, East African countries have steadily increased exports to other countries in the sub-region, as well as countries in Central Africa. While Eastern African countries exported to Southern Africa countries through the early 2010s, the value of exports has decreased over the years. Southern African countries have increased exports to Eastern Africa steadily over the last 20 years, and intra-Southern Africa trade experienced a large spike between 2010 and 2015. Western African countries trade primarily with other Western African countries and have little interaction with countries in other regions. Lastly, Central African countries trade very little with other African countries, including within the region.
Countries tend to trade a variety of crops and other agricultural products with one another, indicating that African agri-food systems are becoming increasingly linked across all areas of agricultural production. The “other” category represents value-added agricultural products, livestock feed, and other by-products from agricultural manufacturing and animal processing.

- Through much of the last two decades, countries in sub-Saharan Africa have been net exporters, though in recent years, Eastern, Central, and Western Africa have become net importers.
- Besides a dip into net import status in the early 2010s, Southern Africa is a net exporter.
- Western Africa has the most negative trade balance of sub-regions within sub-Saharan Africa, followed by Central Africa.
Additional info
Agricultural trade balance is an important indicator of whether domestic agrifood systems are set up to deliver in-demand products to their populations or whether their agricultural products are in-demand by the rest of the world. Net exporters produce products that are highly in-demand, while net importers rely on goods that other countries produce.
Net import and export status varies by sub-region across sub-Saharan Africa. For most years between 2000 and 2021, Southern Africa and Eastern Africa have been net exporters. However, the two sub-regions have been diverging in recent years, as Southern Africa has exported greater trade value, while Eastern Africa has veered into net importer territory. Western Africa has fluctuated widely between net importer and exporter status. Central Africa has been a net importer consistently over the past two decades.
As Sub-Saharan economies develop further and food consumption patterns change, trade balances may change if countries develop economies of scale and policy frameworks that enable and incentivize domestic production of in-demand goods. For now, as long as it is cheaper to import goods rather than produce them domestically, countries will remain net importers.

- Large scale land transactions are sales or concessions of land parcels greater than 200 hectares in size for a variety of purposes, including large-scale agriculture, resource extraction, or conservation.
- Ethiopia and Mozambique are the two countries with the highest frequency of transacting large parcels of land for agriculture, with 79 and 42 recorded transactions above 200 hectares, respectively.
- With over 3% of total land transacted for large-scale agriculture, Liberia, São Tomé and Principe, and Gabon have made some of the most major land transactions relative to country size in sub-Saharan Africa.
- Large scale land transactions are often misreported to shield buyers from scrutiny, so these numbers represent a minimum and true values may be higher
Additional info
Recent decades have seen land consolidation by corporate and foreign state actors for industrial agriculture and natural resource extraction. Large scale land transactions (sales of land parcels greater than 200 hectares) have become increasingly common, particularly in countries known for productive soils and weak land tenure frameworks. Land consolidation is an important trend because of what it represents in terms of the composition of agricultural producers, available cropland, industrialization of agriculture, and the national and regional agricultural policy environment. However, because large scale land transactions can be controversial due to displacement of smallholder farmers or contributions to deforestation, it can be difficult to assess the full scale of land aggregation.
Based on data from the Land Matrix, it is apparent that a small handful of countries in Eastern, Western, and Central Africa have conducted the bulk of land transactions. Ethiopia and Mozambique have in sum conducted over 120 known land transactions for parcels that were 200 hectares or greater. Known large scale land transactions account for 1% of national land area or more in six countries in sub-Saharan Africa; Liberia, São Tomé and Principe, and Gabon are outliers with over 3% of national land held by corporate or foreign government actors for industrial agriculture.
The rate and scale of these transactions demonstrates that many countries in sub-Saharan Africa are engaging in land management practices that are intended to support industrial agricultural developments, potentially at a cost to small-scale farmers. These developments carry implications for AFS employment, since many industrial agricultural developments state an intention to create rural jobs, but these jobs will likely be affected by the future availability of technologies that improve efficiency in industrial agriculture.
Climate and environment

- Maize yields in West, Central, and East Africa are projected to be more negatively impacted by climate change than Southern Africa.
- In particular, Senegal, Gambia, Cote d’Ivoire, Egypt, Sudan, and southern DRC are projected to experience the most severe climate change impacts on maize yields.
- On the other hand, Southern Africa, northern Kenya, and Eritrea are projected to experience positive impacts on maize yield from climate change.
- Wheat yields are projected to be positively impacted by climate change in Eastern and Southern Africa, while those in eastern Sudan and northern Nigeria will be negatively affected.
Additional info
Climate change is a major uncertainty in the future of crop productivity, and thus agri-food systems broadly. While the Intergovernmental Panel on Climate Change (IPCC) has identified various scenarios for average global warming above pre-industrial levels, it is more difficult to predict exactly how crops will react to warming scenarios, because it is difficult to determine whether climate change resistant seed varieties and farming practices will be broadly adopted.
The IPCC’s 2022 report on impacts, adaptation, and vulnerability stated that in a scenario in which global average temperatures increase between 2.4-4.4°C or more above pre-industrial levels by 2100, yields are expected to change dramatically in 2069-2099 compared to yields in 1986-2013. In this figure, brown shows yield reductions and teal shows yield improvements. Maize yields are projected to reduce sharply across Western and Central Africa (shown in brown), and large swaths of Eastern Africa compared to average yields for 1986-2013. Simultaneously, Southern Africa and some areas of Eastern Africa are expected to see a rise in maize productivity (shown in turquoise). Wheat, a less-commonly farmed crop, is expected to fare better under this climate change scenario, with yields expecting to rise across large areas in Eastern and Southern Africa compared to recent average yields.

- Cropland per capita is expected to shrink in the Africa and Middle East region regardless of how societies in the region address climate change.
- Currently, there are approximately 0.2 hectares per person in the region and this is expected to reduce to approximately 0.17 by 2050.
Additional info
Cropland availability, a factor expected to be affected by climate change, is influential over AFS employment. More available cropland may mean that a higher proportion of the population works within the AFS by working on their own farms. It may mean more jobs available in rural areas for young people without access to their own land yet. Additionally, the ability for farmers to work larger plots of land may enable them to adopt technologies that improve agricultural productivity, such as through mechanization.
As this figure indicates, per capita cropland in Africa and the Middle East region is low and expected to get lower as societies grow in population and work to mitigate and adapt to climate change. As of 2020, there is approximately 0.2 hectares of farmland available per person in the region. The three SSPs, with their unique and differentiated assumptions about outcomes like population growth and deforestation, show a relatively narrow range of future values of per capita land availability, at roughly 0.17 hectares/person by 2050.
Notably, cropland availability is expected to decline regardless of climate change scenarios, but this may be due to different causal mechanisms. A scenario with low climate change challenges may be associated with a lower rate of population growth and a push to reduce conversion of wildlands into croplands, while a scenario with high climate change challenges may involve a high rate of conversation of wildland into cropland but also a high rate of population growth.

- Climate change is expected to change maize, rice, and wheat yields, though the severity of changes will depend on the intensity of global climate change and the effectiveness of adaptive measures.
- Maize and wheat will be the most affected crops.
- With no adaptive measures taken, crop yields may decrease up to 50% or more. While adaptive measures will help retain productivity, impacts may be impossible to overcome in Western Africa and Southern Africa.
Additional info
The impact of climate change on crops is expected to be a major driver of future agri-food systems. As global warming, water scarcity, and increasing frequency of extreme weather events take their toll on crop productivity, this will likely have downstream effects that reverberate throughout the agri-food system.
In this figure, boxplots show a synthesis of projected staple crop impacts, with and without adaptation measures (such as crop cultivars, irrigation strategies, and planting dates), with solid boxes representing yield without adaptation and empty boxes representing yield with adaptation. Yield impacts are presented for various global warming scenarios – including 1.5, 2, 3, and 4 degrees of warming relative to pre-industrial levels. Across the board, staple crop yields are projected to decline under increasing warming scenarios. Adaptation measures can offset yield reductions substantially. However, in some cases, adaptation may have little effect – such for maize cultivation in Western Africa, or for wheat cultivation in Southern Africa.
These yield changes will carry ramifications for agri-food systems in Africa. Yield reductions may mean that African countries increase their reliance on imported crops. Alternatively, widespread adoption of adaptive strategies could lead to growth of secondary markets that support implementation of adaptive measures in agriculture.
FOOD SYSTEM
Agricultural production
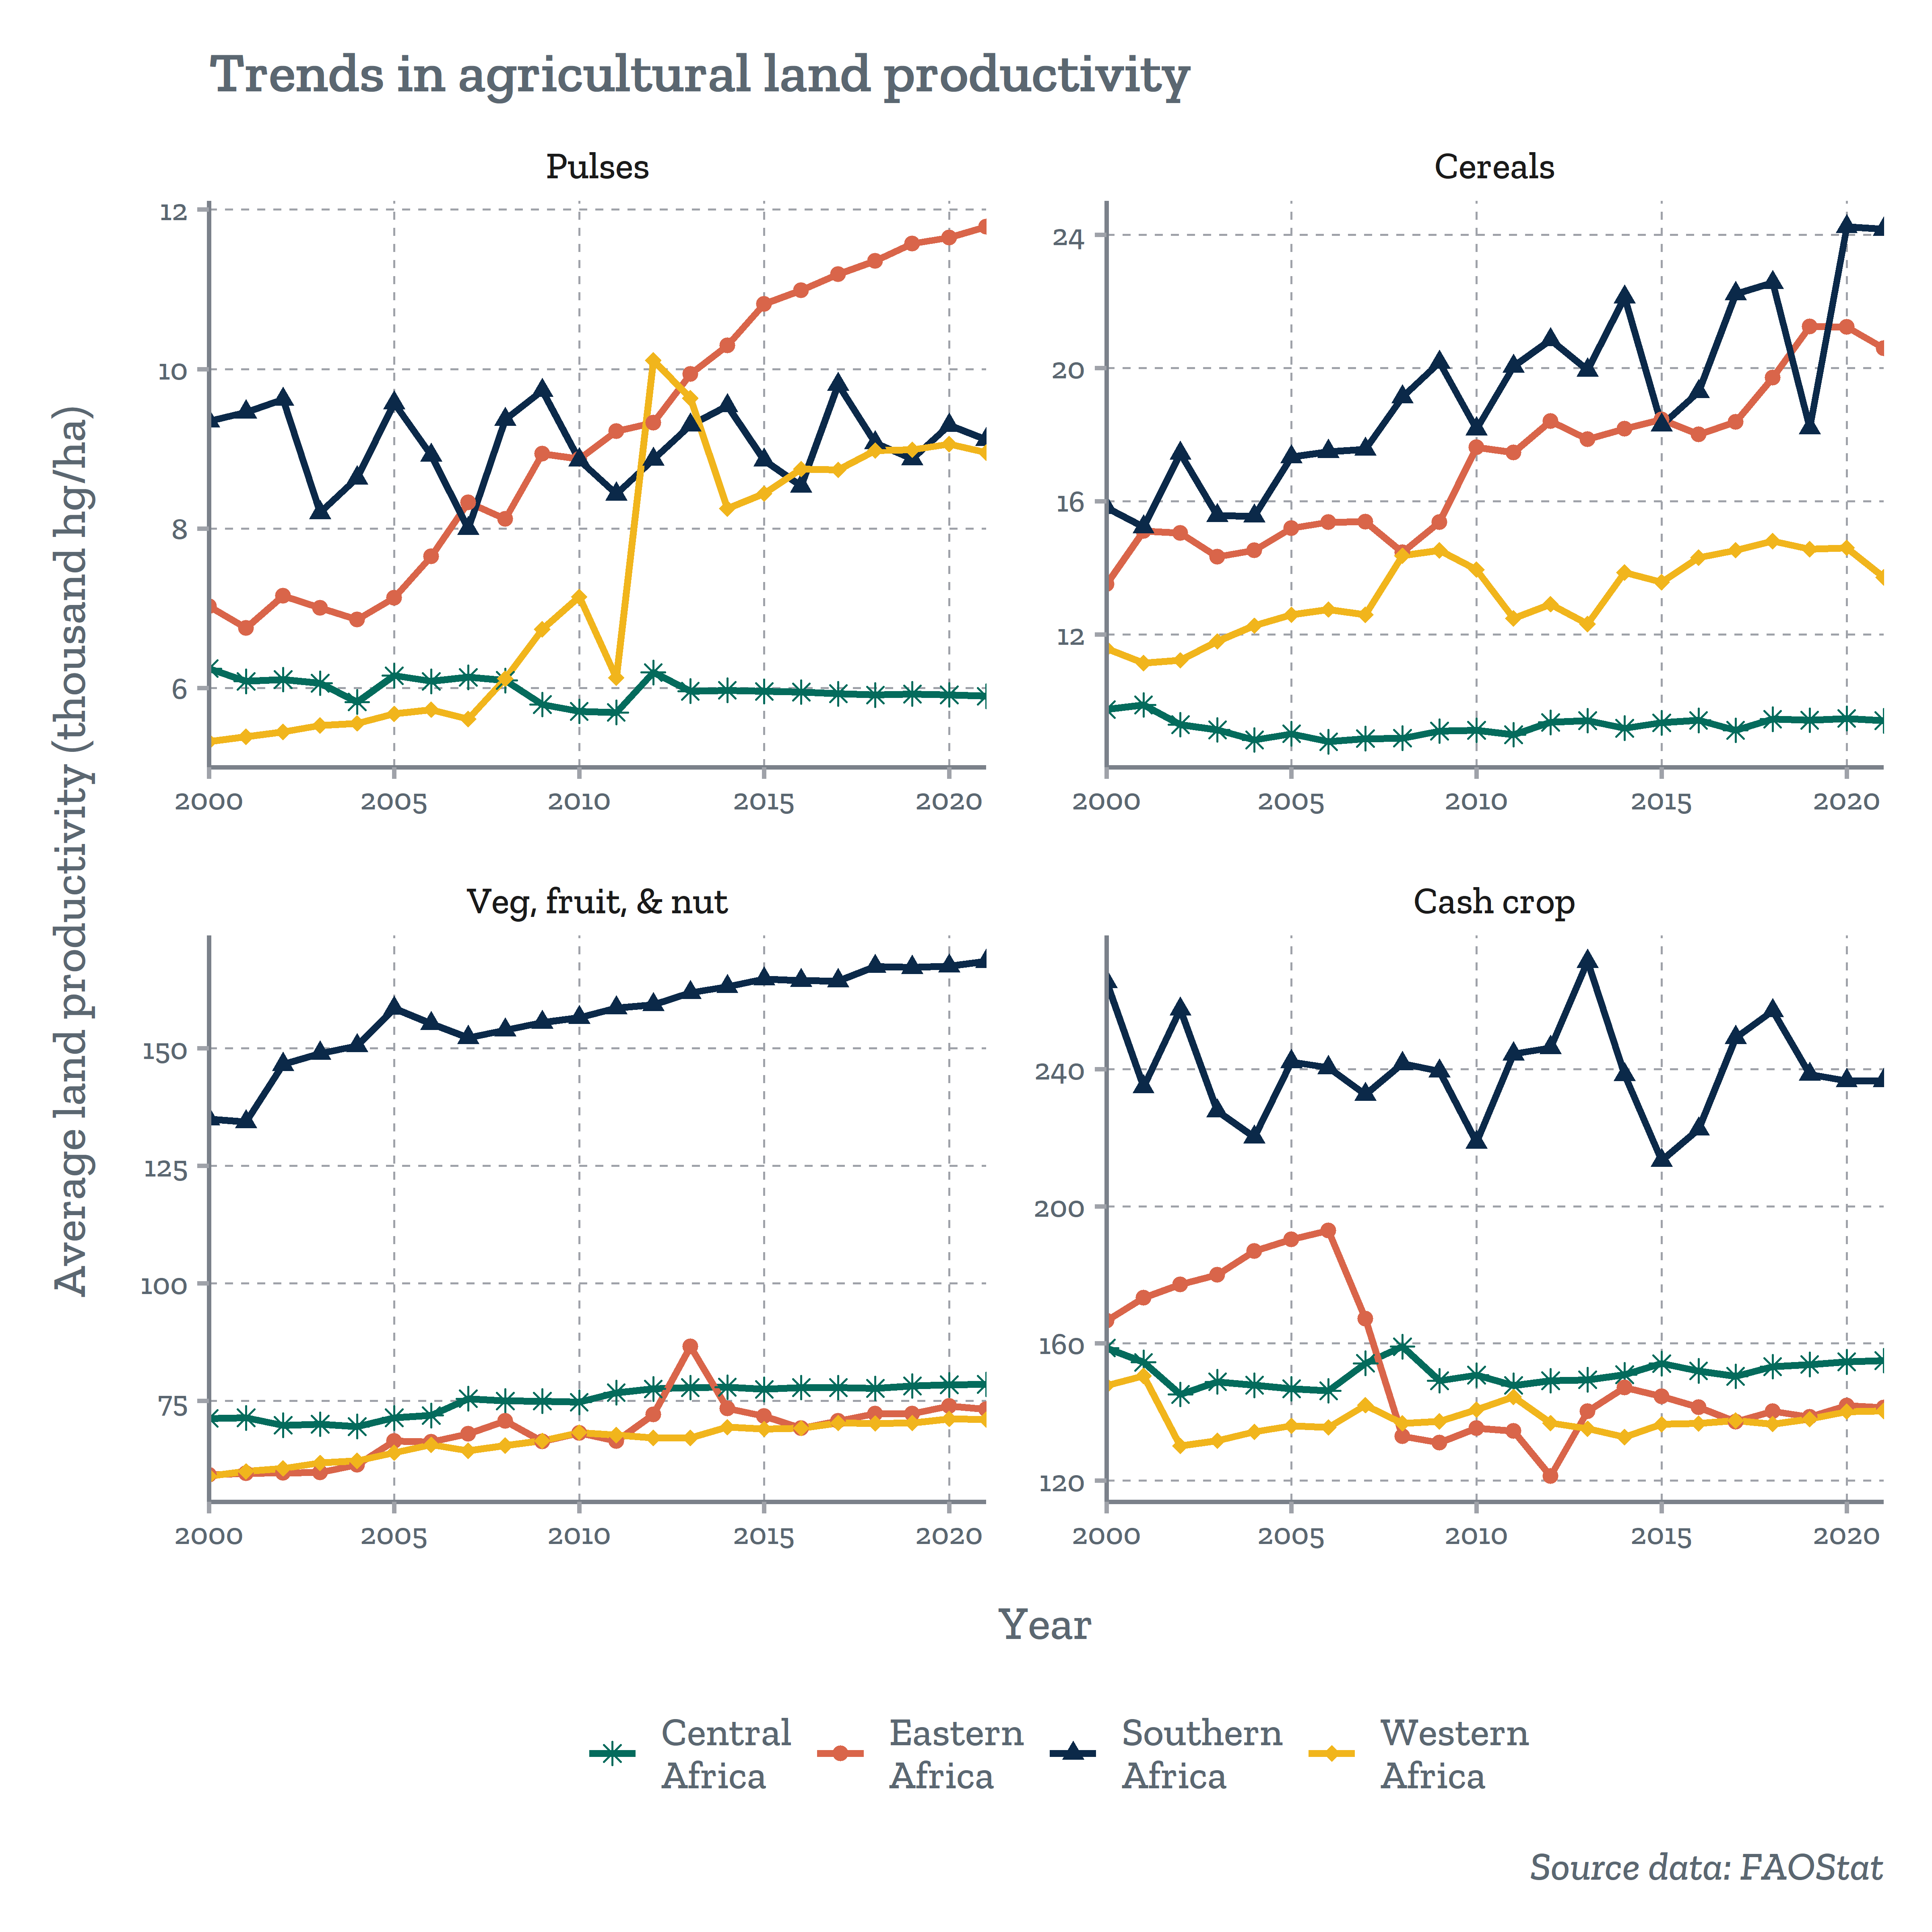
- Land productivity varies across crop categories, with cash crops having the highest productivity, followed by vegetables, fruit and nuts. Southern Africa has the highest land productivity for these two categories.
- Land productivity for pulses and cereals have increased over the years in Eastern and Western Africa, while Central Africa has seen virtually no increases in crop productivity across all crop types.
Additional info
Since 2000, land productivity trends, measured as thousands of hectograms of a crop produced per hectare of land, have varied across crop types and sub-regions. Eastern Africa has had large growth in land productivity for pulses and cereals, but has had minor growth in productivity for vegetables, fruits, and nuts, and a decline in productivity for cash crops. Southern Africa has had growth in productivity for cereals and vegetables, fruit and nuts, but has had stagnation in land productivity in pulses and cash crops. Western Africa has had large growth in productivity for pulses, has had small growth for cereals and vegetables, and has remained stable for cash crop. Crop productivity in Central Africa has been stagnant across all crop categories.
Notably, Southern Africa has significantly higher land productivity for vegetables, fruits and nuts, as well as cash crops, compared to other sub-regions. The only crop types for which there was growth in land productivity across multiple sub-regions were cereals and pulses, though only Eastern and Western Africa improved land productivity in pulses.
Land productivity is an indicator of whether farms will be able to feed the growing population without having to convert large amounts of undeveloped land into farms. Growth in cereal and pulse land productivity is an indication that sub-Saharan African farms may be able to meet demand. However, economic growth may also mean changing diets, which may lead to shifts away from cereal- and pulse-heavy farming. Meanwhile, stagnation in land productivity for vegetables, fruits, and nuts, and cash crops could indicate limits on how much value sub-Saharan African farms can produce for export markets. Stagnating crop productivity per unit of land could mean that farms may expand, which could mean growth in agricultural jobs. Alternatively, more efficient farming practices could mean that farms will grow at a slower pace, meaning the same number of agricultural jobs for a larger future population.

- Since 2000, total agricultural production value has risen dramatically in Eastern and Western Africa and has risen gradually in Central and Southern Africa.
- Western Africa has the highest regional agricultural production value of all sub-Saharan Africa sub-regions, at over $125 billion in 2020.
- For Eastern, Western, and Central Africa, agricultural production value has been primarily driven by vegetables, fruits, and nuts. In Southern Africa, however, animal products represent the greatest share of production value.
Additional info
Agricultural production value is an important indicator of the overall productivity of the agriculture sector and can provide an understanding of the geographies and types of products that are driving agricultural growth. While agricultural production value is highest in Western Africa, production value has more than doubled in Eastern Africa since 2000. Central Africa experienced modest growth over the same period and Southern Africa has exhibited little growth since 2000.
Fruit, vegetable, and nut production has driven growth in agricultural production value over the past 20 years and constitutes the dominant share of production value in sub-Saharan Africa. However, animal products represent a substantial share of production value in Eastern Africa and Southern Africa. Cereals are also a notable portion of overall production value in Eastern and Western Africa. Cash crops contribute a small share, which has steadily declined over 2000-2020 as overall production value has increased.
These trends in agricultural production value demonstrate that Eastern and Western Africa are continuing to see large growth in their agriculture sectors, while Central and Southern Africa are experiencing some stagnation. These trends are likely to have implication for the abundance of AFS employment opportunities in each region over the next 30 years.

- Large scale land transactions are sales or concessions of land parcels greater than 200 hectares in size for a variety of purposes, including large-scale agriculture, resource extraction, or conservation.
- Ethiopia and Mozambique are the two countries with the highest frequency of transacting large parcels of land for agriculture, with 79 and 42 recorded transactions above 200 hectares, respectively.
- With over 3% of total land transacted for large-scale agriculture, Liberia, São Tomé and Principe, and Gabon have made some of the most major land transactions relative to country size in sub-Saharan Africa.
- Large scale land transactions are often misreported to shield buyers from scrutiny, so these numbers represent a minimum and true values may be higher.
Additional info
Recent decades have seen land consolidation by corporate and foreign state actors for industrial agriculture and natural resource extraction. Large scale land transactions (sales of land parcels greater than 200 hectares) have become increasingly common, particularly in countries known for productive soils and weak land tenure frameworks. Land consolidation is an important trend because of what it represents in terms of the composition of agricultural producers, available cropland, industrialization of agriculture, and the national and regional agricultural policy environment. However, because large scale land transactions can be controversial due to displacement of smallholder farmers or contributions to deforestation, it can be difficult to assess the full scale of land aggregation.
Based on data from the Land Matrix, it is apparent that a small handful of countries in Eastern, Western, and Central Africa have conducted the bulk of land transactions. Ethiopia and Mozambique have in sum conducted over 120 known land transactions for parcels that were 200 hectares or greater. Known large scale land transactions account for 1% of national land area or more in six countries in sub-Saharan Africa; Liberia, São Tomé and Principe, and Gabon are outliers with over 3% of national land held by corporate or foreign government actors for industrial agriculture.
The rate and scale of these transactions demonstrates that many countries in sub-Saharan Africa are engaging in land management practices that are intended to support industrial agricultural developments, potentially at a cost to small-scale farmers. These developments carry implications for AFS employment, since many industrial agricultural developments state an intention to create rural jobs, but these jobs will likely be affected by the future availability of technologies that improve efficiency in industrial agriculture.
Employment across the AFS

- Across countries that report youth employment by AFS segment, typically rural-based AFS jobs such as agricultural and fisheries production represent the largest share of employment among 15-24-year-olds, the age range the International Labor Organization (ILO) uses to define the youth population.
- More urban-based jobs, such as agro-processing, retail, hotels and food service, and storage, employ smaller percentages of youth.
- As youth urbanization continues, demand for more urban AFS jobs will likely expand.
Additional info
It is difficult to discern clear longitudinal patterns in youth employment in AFS due to patchiness in reporting; most countries in sub-Saharan Africa do not regularly report employment data disaggregated by AFS sector, age group, or by urban/rural areas. Nonetheless, the available data demonstrate the of jobs in agricultural production among youth across many sub-Saharan African economies.
Across all countries that report data for youth employment (defined by the ILO as 15-24), the majority of working youth are employed in agricultural or fisheries production. A notable percentage of youth in some countries work in food service, and an insignificant portion of youth work in agro-processing and retail. Some countries report that a sizable percentage of youth work in storage, a key function in AFS. The data are not disaggregated further to uncover the percentage of youth that are employed in storage specifically related to food systems.
Taken together, the ILO data from recent years demonstrate that even as the agricultural share of overall economic activity has decreased, it remains to be one of the primary ways in which youth have found their way into AFS jobs in recent years.

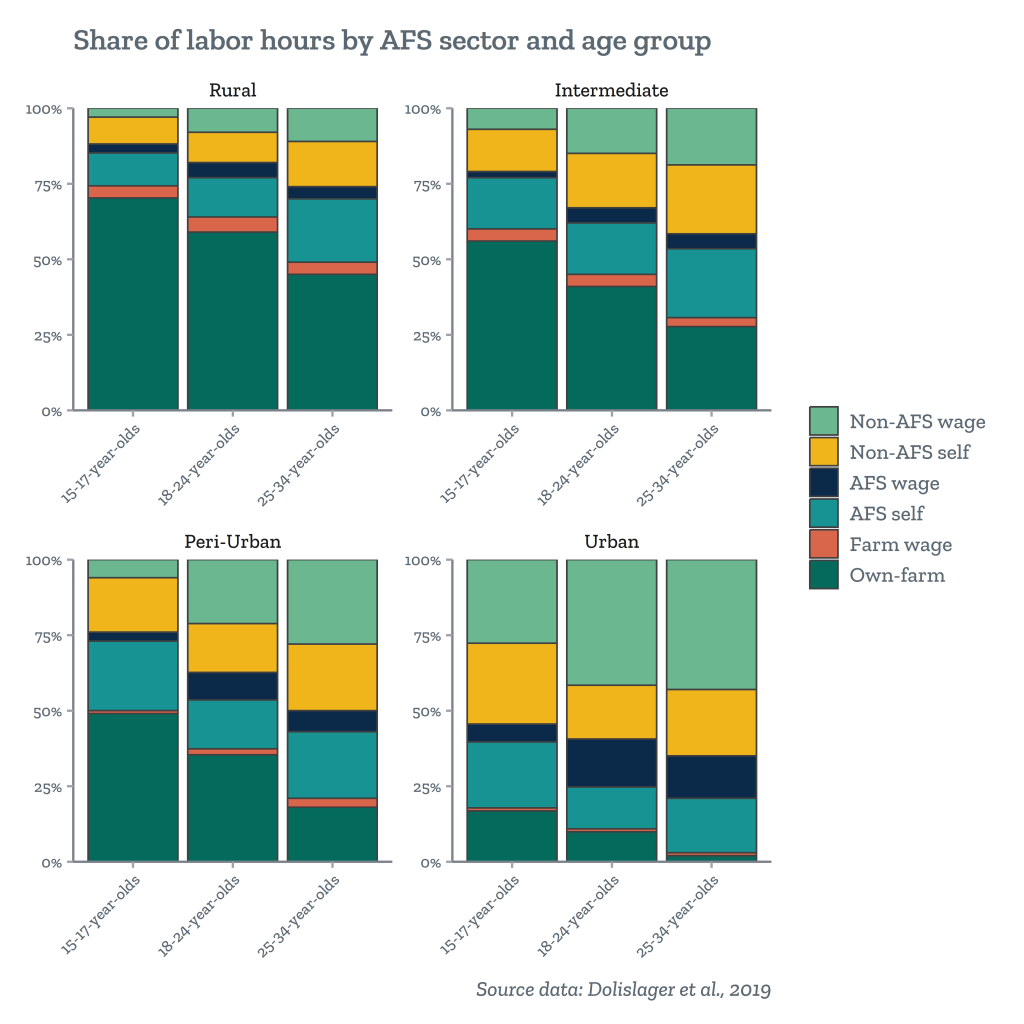
- In rural and intermediate areas (defined as the least- and second-least dense population density quartiles), a majority of younger youths’ (15-24-year-olds) working hours are spent in agriculture, while substantial portions of older youths’ (24-34-year-olds) working hours are spent on AFS self-employment or non-AFS work.
- In peri-urban areas, agriculture is still an important source of employment for younger youths, while a majority of older youths find employment elsewhere in the AFS or outside it altogether.
- In urban areas, less than 50% of youths’ (15-34-year-olds) working hours are spent in AFS employment.
Additional info
Dolislager et al. (2019) collated data from more than 30,000 households across six countries in Eastern and Western Africa in order to derive the overall share of labor hours worked by people across age groups and geographic settings. The data are from national surveys collected between 2013-2016, meaning that the data represent a snapshot in time for each country. Their findings indicate that across African labor markets, youth participate in a wide array of employment, both within and outside of the AFS, and that there are clear spatial and age-related patterns associated with employment across the AFS. By-and-large, the data indicate that younger and more rural populations are more likely to find employment within agriculture and other AFS segments, while older and more urban populations are more likely to find employment outside the AFS.
Economic development will likely have an outsized effect on these patterns. Previous figures indicate that economic growth in Africa is outstripping growth in the agriculture sector, and agricultural jobs represent a shrinking share of overall labor. In every geographic setting, older youths (25-34-year-olds) are less likely to work in agriculture than younger youths (15-24-year-olds); even in rural settings, 25-34-year-olds spend fewer than 50% of labor hours on agriculture.
Without longitudinal data, it is not possible to examine how youth labor preferences and behaviors respond to broader economic patterns. However, as other figures indicate, agricultural share of employment tends to decrease as economic development increases. Also, it is expected that a higher proportion of youth will live in cities, even though overall population growth means that there will be more rural youth in the future than there are today. Overlaid on this figure, these trends suggest that rural youth may have a harder time finding farmwork due to decreasing economic reliance on the agriculture sector and rural population growth. In urban areas, where youth currently spend less than 50% of labor hours working within the AFS, youth may continue expanding their non-AFS employment.
Food consumption

- Food supply has remained relatively constant at the subregion-level from 2010 to present.
- Over this period, Eastern Africa has had the lowest overall average food supply (~2,500 g/capita/day) while Central and Western Africa’s food supply neared 3,500 g/capita/day.
- Southern Africa had the highest per-capita supply of animal products, while Central and Western Africa had the highest per-capita supply of vegetable oil and vegetables, fruits, and nuts.
Additional info
Food supply is defined as the amount of food available for consumption by people on an annual basis and is calculated by adding food produced with food imported, and subtracting food exported. Because reliable annual and national-level records of food consumption are not often available, food supply is an important indicator of potential food consumption patterns. Food supply also relates to economic growth; high income county populations tend to consume more animal products and processed foods.
Between the years 2010 and 2020, food supply patterns across sub-Saharan Africa were relatively stable. By the end of the decade, Central and Southern Africa had a slight reduction in overall food consumed, while Eastern Africa had a slight uptick of overall food supply. Central and Western Africa have similar food supply profiles – in both sub-regions, the largest share of food supply comes from fruits, vegetables, and nuts, with cereals and vegetable oil playing important roles as well. Eastern Africa, on the other hand, had an even split between cereals and vegetables, fruit, and nuts, with animal products and vegetable oil representing smaller but important portions of food supply. In contrast, Southern African countries’ food supply is primarily made up of cereals and animal products, with a smaller portion coming from vegetables, fruits, and nuts and vegetable oil.
The stability in food consumption profiles reflects the complex and interconnected nature of the components of agri-food systems. Patterns in production and consumption are reinforced by the interdependent relationship between producers and consumers. Meanwhile, changes to food systems are constrained by the institutional environment in which the systems exist. Actors seeking to enact change will need to be prepared to push back against embedded resistance to change and remain resilient to unpredicted shifts in the system.
SYSTEM OUTCOMES
Economic wellbeing

- For the majority of countries reporting data on youth unemployment, over 10% of youth are unemployed or not in vocational training.
- The pattern applies across sub-regions, with South Africa and several countries in Eastern and Western Africa having the highest rates of youth unemployment.
- In many countries, a higher percentage of urban youth compared to rural youth are unemployed or not in vocational training.
Additional info
The prevalence of youth not in employment or vocational training (NEET) is a critical outcome related to how effective agri-food systems are at creating decent job opportunities and economic wellbeing for young people.
Among countries in sub-Saharan Africa that report data on youth unemployment and vocational training, the majority of countries report that at least 10% of youth do not have jobs and are not in any vocational training. In most countries, urban youth have slightly higher unemployment rates compared to rural youth However, South Africa, Senegal, and Mali all have a large portion of rural youth who are not able to find employment or any vocational training opportunities. NEET prevalence is only loosely correlated with a country’s GDP per capita.
These data demonstrate that there are large portions of urban and rural youth populations that are potentially ready to engage in AFS employment, provided adequate investment in creating youth opportunities.

- Agricultural labor provides differentially greater economic benefits for men, compared to women in all reporting countries. Rwanda and Cameroon have the smallest wage gap (in dollars), but also the lowest wages.
- Men in Ghana and Ethiopia are the only agricultural wage workers earning more than an average of $15/day.
Additional info
A key challenge is to create not only decent jobs from agri-food systems, but to create employment opportunities that are equitable regardless of gender, age, and ethnicity. Looking at sex disaggregation for average daily wage in agriculture can provide a sense of whether decent job opportunities exist for both men and women.
In all countries that reported average daily wage in agriculture, males make more money from agriculture than females. This is particularly prevalent in Ghana and Burkina Faso, where males make over $7 per day more than females. Comparatively, in Ethiopia, where reported agricultural wages are some of the highest reported in sub-Saharan Africa, males make about $1 more than females per day. While Rwanda and Cameroon have almost no wage gap, they also report some of the lowest agricultural wages in the region.
These data demonstrate that while agri-food systems – and particularly agricultural labor – can provide economic wellbeing to workers, these benefits are not accrued equally between men and women at this time, and more work is needed to improve gender parity.

- Over the past 30 years, Southern Africa has consistently had threefold to fourfold the GDP per capita levels of other sub-Saharan subregions.
- Outside of Southern Africa, growth in real GDP per capita has been tepid – levels in Central Africa in 2020 were roughly equal to levels in 1990. Eastern and Western Africa saw increases of roughly ~$1,300 over the 30 years.
Additional info
Overall economic growth is a significant uncertainty for agri-food system development. As economies grow and diversify, agriculture tends to contribute a smaller share to overall economic output, and niches may open for agri-food system entrepreneurs to innovate in other segments of the agri-food system. Additionally, growth in GDP per capita means the development of a middle class with more disposable income and different tastes in food products compared to traditional home-cooked foods.
Aside from countries in Southern Africa, sub-Saharan Africa has experienced tepid growth over the past 30 years. Western Africa’s GDP per capita has increased from approximately $2,500 to approximately $4,500. Central African countries’ GDP per capita has fluctuated around $5,000, and Eastern African countries’ GDP per capita has increased from less than $1,000 in 1990 to nearly $2,500 by 2020.
This pattern in economic development suggests that the middle class is slowly emerging in most regions of sub-Saharan Africa. While emergence of the middle class means there may more interest in new food types (e.g., processed foods), the slow rate of growth could mean that it will take time for economies of scale to develop to enable widescale domestic production.
Nutrition and food security

- The prevalence of obesity among adults (people aged 18 and older) increased between 2001 and 2016 in all sub-regions.
- The prevalence of obesity is rising at a steady pace in Southern Africa; in the other three sub-regions, the pace has quickened in recent years.
- Obesity is most prevalent in Southern Africa. By 2016, over a quarter of the population of Southern Africa was obese, compared to less than 10% among adults in Central, Eastern, and Western Africa.
Additional info
According to the FAO, obesity is linked to diabetes, heart disease, certain cancers, and death. Ensuring that all people have access to healthy food and well-rounded diets can prevent obesity, improving the health of the population and the capacity of the labor force.
Since 2000, the prevalence of obesity has risen at a slow but steady pace across the continent. Historically, obesity has been less prevalent in Central, Eastern, and Western Africa than in Southern Africa, where undernourishment is lower, per-capita food consumption and income are higher, and the population is older. Though the burden of obesity remains low in the other three subregions, it has been increasing at a growing pace in recent years. By 2016, there were over 40 million obese adults living across sub-Saharan Africa.
As agri-food systems grow and change, healthy food must be made affordable and accessible. At the same time, obesity can be most effectively combatted alongside developments outside the agri-food system (for example, by improving access to healthcare and recreational opportunities).

- In Central, Eastern, and Western Africa, the prevalence of undernourishment among the total population declined in the 2000s, but increased again in the 2010s.
- In Southern Africa, the prevalence of undernourishment doubled between 2001 and 2021.
- In all four sub-regions, undernourishment has been rising for at least the past 5 years.
- Undernourishment continues affects a greater share of the populations of Central and Eastern Africa than of Western and Southern Africa.
Additional info
There was mixed progress towards reducing undernourishment among the total population in the 2000s, but the following decade saw most of this progress reversed and undernourishment is now increasing across sub-Saharan Africa. In Western Africa, the prevalence of undernourishment is the same today as it was in 2001; in Southern Africa, the prevalence of undernourishment has doubled. In Central and Eastern Africa, undernourishment declined until 2011, when the trend reversed directions; today, nearly 30 percent of the populations of these two regions face undernourishment.
The plateau and subsequent reversal of progress towards reducing undernourishment coincides with stagnation in other areas of the agri-food system. During these same two decades, land productivity has stagnated for most crops, while available cropland per capita has decreased. Meanwhile, food consumption patterns have not shifted in any sub-region for the past decade, leaving many people (particularly those in Central, Eastern, and Western Africa) without access to a balanced, nutritious diet.
Environmental sustainability

- Sub-Saharan African countries have experienced forest loss almost across the board. Only Lesotho, Mauritania, Niger, and South Sudan have experienced any forest gain since 2000.
- Forest loss has been most pronounced in Eastern Africa, with Uganda, Tanzania, and Mozambique each losing at least 10% of their forests since 2000.
- Forest loss is comparatively less intense in Central Africa and Southern Africa, with several countries experiencing between no and 2% forest loss in the past two decades.
Additional info
The ability for agri-food systems to sustain themselves is dependent, in part, on the environmental sustainability of farming practices. One indicator of environmental sustainability is deforestation at the national level. Agriculture is one of the leading causes of deforestation globally, making forest loss an indicator for whether agri-food systems are contributing to environmental destruction. Additionally, forests provide important ecosystem services that support agricultural productivity, such as water filtration, thermoregulation, and habitat for pollinators, making deforestation an indicator of the sustainability of agricultural activities.
Countries across sub-Saharan Africa have seen varying degrees of deforestation over the past 20 years. At least 10% of forests have been converted into other land-use types in several Eastern African countries. Most Western African countries have similarly had between 5% – 10% of forests disappear since 2000. Central Africa and Southern Africa have experienced lower rates of deforestation, with several countries’ forest cover reducing between 0% – 5% in the past 20 years.
These deforestation rates suggest that agri-food systems and natural resource conservation do not have a harmonious relationship at this time. As more forests in sub-Saharan Africa are deforested, the loss of related ecosystem services could lead to a reduction in productivity, affecting the functioning of entire agri-food systems at a local, national, and sub-regional level.
KEY TRENDS AMONG YOUTH IN SUB-SAHARAN AFRICA

- The population pyramids of Central, Eastern, and Western Africa have been similar since 1980, with rapid growth and a triangular distribution in which the youngest cohorts have the largest populations.
- Southern Africa is the only sub-region which has not seen much population growth since 2000, as well as the only sub-region where the over-35 population share has grown substantially over time.
Additional info
From 1980 to 2000, and again from 2000 to 2020, the population of sub-Saharan Africa grew rapidly, driven almost entirely by growing populations in Central, Eastern, and Western Africa. In these three sub-regions, the age distribution of the population has not shifted over time, remaining skewed towards young people. In Southern Africa, by contrast, the age distribution of the population has shifted, from being similarly youth-skewed in 1980 to being more balanced between children and adults between 25-44 in 2020.
The rapid expansion of the population of children living in sub-Saharan Africa has come alongside other changes, such as climate change, the concentration of young populations in urban areas, and broader economic development across the region. This shifting landscape likely puts pressure on agri-food systems to increase production and food supply, and meet an ever-growing demand for food. However, these changes also present enormous opportunity. Today’s youth are becoming the consumers, producers, workers, and innovators who will drive generations of positive transformation in agri-food systems, so long as those systems can support their health and enable them to grow and thrive.

- Between 2020 and 2050, the populations of Central, Eastern, and Western Africa will grow without major changes in the age distribution, but the share of people over 35 is projected to increase in Southern Africa.
- However, youth and children will still represent the majority of the population in Central, Eastern, and Western Africa.
- By 2050, the population of adults above age 35 will more than double in Central, Eastern, and Western Africa.
Additional info
Although very young children will still make up the greatest population share relative to any other cohort, it is projected that between 2020 and 2050, there will be a slight upward shift in the age distribution of the population of sub-Saharan Africa. In most sub-regions, population growth will be more concentrated among young adults compared to other age groups, with the most growth occurring in the population of people ages 15-34, particularly in Eastern and Western Africa. In contrast, the population share of people older than 40-years-old will grow faster than other population segments. The population of adults 55 and older will grow in all four sub-regions.
Though shifts in population age distributions are driven by factors both within and outside agri-food systems, these systems provide an enabling (or inhibiting) environment for population growth and well-being. By improving the availability and accessibility of healthy food, agri-food systems can promote growth in the population of young adults by ensuring that children can grow up healthy and nourished. Meanwhile, a healthier and larger adult population provides new demands for employment and opportunities for innovation within agri-food systems.

- The 18-35 youth population in sub-Saharan Africa has been steadily growing since 1980 and is projected to rise rapidly to reach levels similar to those of South Asia – at approximately 650 million people – by 2050.
- In contrast, East Asia’s youth population is expected to shrink, even under a high fertility scenario, while growth in Latin America and the Caribbean’s youth population will be flat in coming decades.
Additional info
Over the coming decades, the population of youths (18-35-year-olds) in sub-Saharan Africa is expected to grow exponentially. By the year 2050, it is expected that there will be between 600-650 million youths in the region – rivaling the plateauing youth population in South Asia and dwarfing East Asia and Latin America.
This rapid growth among the youth population in sub-Saharan represents a challenge and opportunity for agri-food systems and employment. This expected trajectory in the youth population may lead to transformation of agri-food systems and sub-Saharan economies more broadly. Hundreds of millions more young people looking for work represents massive growth in the labor pool for new ventures as agri-food systems grow and transform. Additionally, with dramatic increases in the number of young people consuming food, farmers and food processors will seek to meet demand through innovation and entrepreneurship.
Growth in employment in agri-food systems will ultimately depend on where youth live relative to centers of agricultural production and processing. The figures below represent a demographic shift in terms of the rural/urban divide.


- The youth population is expected to grow and urbanize at different rates across regions in sub-Saharan Africa.
- Eastern and Western Africa are expected to see the largest growth in youth populations by 2050.
- The majority of youth in Southern Africa, Western Africa, and Central Africa will live in urban areas by 2050.
Additional info
Youth demand for AFS employment will be highly influenced by the spatial distribution of youth. According to Shared Socioeconomic Pathways (SSP) projections models produced for the Intergovernmental Panel on Climate Change (IPCC), most regions within sub-Saharan Africa will have a primarily urban youth population. By 2050, the urban share of Eastern African youth is anticipated to reach 45%.
Overall, the largest growth in youth population will be in Eastern and Western Africa, while Central Africa will see modest growth and Southern Africa will remain flat. These regions will differ in expected spatial distribution of youth. By 2050, the majority of youth in Western, Central, and South Africa will live in cities, while a small and narrowing majority of Eastern African youth will continue to reside in rural areas as they do today.
The implication of this trend is that more Eastern African youth will seek AFS employment in agriculture or other rural-centered food jobs such as aggregation and transportation, given that these sectors are concentrated in rural areas. The more highly urbanized youth in Western, Central, and Southern Africa may be more likely to find AFS employment in food manufacturing, distribution, and service industry jobs.
The population growth and urbanization models represented in these figures are based on an SSP-2 scenario, which assumes moderate challenges to climate change adaptation and mitigation. Adaptation refers to actions taken to improve resilience to the effects of climate change (e.g., planting mangroves in coastal areas), while mitigation refers to actions taken to reduce contributions to climate change (e.g., curbing greenhouse gas emissions). Moderate challenges to adaptation and mitigation implies political or economic barriers to taking action at the national-, regional-, or global-levels.

- Youth (15-35-year-olds) make up the majority of AFS workers in Guinea-Bissau, Malawi, Mozambique, and Tanzania; youth are also the majority of agricultural workers in Guinea-Bissau, Malawi, Mozambique, Niger, and Tanzania.
- For food processing and service jobs, youth represent over 50% of workers in Malawi, Mozambique, and Tanzania; among food non-food agricultural product manufacturing jobs, youth represent over 50% of workers in Malawi, Tanzania, Senegal, and Nigeria.
- The agri-food system labor force is younger in most sub-Saharan African countries than in countries like Georgia or Peru.
Additional info
Across the countries shown in the figure, youth make up varying shares of the agri-food workforce across sub-Saharan African countries. The share of AFS employment held by youth (ages 15-35) ranges from approximately one-fourth (Nigeria) to nearly 60% (Malawi) of the AFS workforce. In most countries, the age distribution of the entire agri-food system workforce closely mirrors the age distribution in the agriculture subsector, but differs for other subsectors—for example, in Nigeria, youth make up less than 30% of employment across agri-food systems, but over 60% of employment in the manufacture of non-food agricultural products. Nigeria is also the only country in sub-Saharan Africa where people older than 65 make up at least 10% of the agri-food workforce.
As the populations of young adults living in sub-Saharan Africa are projected to grow and become increasingly urbanized, the age distribution in rural- and urban-centered AFS sectors will likely change. These changes will also likely be affected by regional distinctions in urbanization rates. For example, in Western Africa, where the majority of youth is expected to live in urban areas by 2050, youth employment in food manufacturing and services may grow faster than youth employment in agriculture. In contrast, in Eastern Africa, where the majority of youth will still live in rural areas by 2050, youth employment in agriculture may grow faster than employment in manufacturing.
The implication of this trend is that more Eastern African youth will seek AFS employment in agriculture or other rural-centered food jobs such as aggregation and transportation, given that these sectors are concentrated in rural areas. The more highly urbanized youth in Western, Central, and Southern Africa may be more likely to find AFS employment in food manufacturing, distribution, and service industry jobs.
The population growth and urbanization models represented in these figures are based on an SSP-2 scenario, which assumes moderate challenges to climate change adaptation and mitigation. Adaptation refers to actions taken to improve resilience to the effects of climate change (e.g., planting mangroves in coastal areas), while mitigation refers to actions taken to reduce contributions to climate change (e.g., curbing greenhouse gas emissions). Moderate challenges to adaptation and mitigation implies political or economic barriers to taking action at the national-, regional-, or global-levels.

- Globally, richer countries tend to have lower proportions of youth (age 34 or younger) in the rural agricultural labor force, compared to lower income countries.
- The share of youth in the rural agricultural labor force trended downwards from 2005 to 2019 across all income levels but was less pronounced in low- and low-middle-income countries.
- Regardless of income status, a higher portion of rural agricultural workers are youths, compared to people above the age of 55.
Additional info
This figure suggests that countries with lower incomes have a relatively larger youth share of rural agricultural workers (age 34 or younger), while wealthier countries have a relatively larger share of agricultural workers who are age 55 and older. Taken together, these observations suggest that both youth and adults between ages 35 and 54 make up a significantly smaller share of the rural agricultural labor force in lower income countries.
Between 2005 and 2019, youth share of rural agricultural employment decreased in higher-income countries but did not decrease at the same rate as lower-middle income countries. There was no strong trend among low-income countries. This indicates that economic growth in sub-Saharan African countries may be associated with reductions in the rate at which youth work in rural agricultural jobs.
Demographic shifts may further contribute to changes in these trends. Population data and projections from sub-Saharan Africa suggest that much of the projected population growth in the region in the coming decades will be concentrated in adults older than 35. By 2050, this growth in the adult population, combined with the increasing migration of younger people to urban areas, may facilitate a reduction in the share of rural agricultural workers who are youth.

- Across countries that report youth employment by AFS segment, typically rural-based AFS jobs such as agricultural and fisheries production represent the largest share of employment among 15-24-year-olds, the age range the International Labor Organization (ILO) uses to define the youth population.
- More urban-based jobs, such as agro-processing, retail, hotels and food service, and storage, employ smaller percentages of youth.
- As youth urbanization continues, demand for more urban AFS jobs will likely expand.
Additional info
It is difficult to discern clear longitudinal patterns in youth employment in AFS due to patchiness in reporting; most countries in sub-Saharan Africa do not regularly report employment data disaggregated by AFS sector, age group, or by urban/rural areas. Nonetheless, the available data demonstrate the of jobs in agricultural production among youth across many sub-Saharan African economies.
Across all countries that report data for youth employment (defined by the ILO as 15-24), the majority of working youth are employed in agricultural or fisheries production. A notable percentage of youth in some countries work in food service, and an insignificant portion of youth work in agro-processing and retail. Some countries report that a sizable percentage of youth work in storage, a key function in AFS. The data are not disaggregated further to uncover the percentage of youth that are employed in storage specifically related to food systems.
Taken together, the ILO data from recent years demonstrate that even as the agricultural share of overall economic activity has decreased, it remains to be one of the primary ways in which youth have found their way into AFS jobs in recent years.
- In rural and intermediate areas (defined as the least- and second-least dense population density quartiles), a majority of younger youths’ (15-24-year-olds) working hours are spent in agriculture, while substantial portions of older youths’ (24-34-year-olds) working hours are spent on AFS self-employment or non-AFS work.
- In peri-urban areas, agriculture is still an important source of employment for younger youths, while a majority of older youths find employment elsewhere in the AFS or outside it altogether.
- In urban areas, less than 50% of youths’ (15-34-year-olds) working hours are spent in AFS employment.
Additional info
Dolislager et al. (2019) collated data from more than 30,000 households across six countries in Eastern and Western Africa in order to derive the overall share of labor hours worked by people across age groups and geographic settings. The data are from national surveys collected between 2013-2016, meaning that the data represent a snapshot in time for each country. Their findings indicate that across African labor markets, youth participate in a wide array of employment, both within and outside of the AFS, and that there are clear spatial and age-related patterns associated with employment across the AFS. By-and-large, the data indicate that younger and more rural populations are more likely to find employment within agriculture and other AFS segments, while older and more urban populations are more likely to find employment outside the AFS.
Economic development will likely have an outsized effect on these patterns. Previous figures indicate that economic growth in Africa is outstripping growth in the agriculture sector, and agricultural jobs represent a shrinking share of overall labor. In every geographic setting, older youths (25-34-year-olds) are less likely to work in agriculture than younger youths (15-24-year-olds); even in rural settings, 25-34-year-olds spend fewer than 50% of labor hours on agriculture.
Without longitudinal data, it is not possible to examine how youth labor preferences and behaviors respond to broader economic patterns. However, as other figures indicate, agricultural share of employment tends to decrease as economic development increases. Also, it is expected that a higher proportion of youth will live in cities, even though overall population growth means that there will be more rural youth in the future than there are today. Overlaid on this figure, these trends suggest that rural youth may have a harder time finding farmwork due to decreasing economic reliance on the agriculture sector and rural population growth. In urban areas, where youth currently spend less than 50% of labor hours working within the AFS, youth may continue expanding their non-AFS employment.
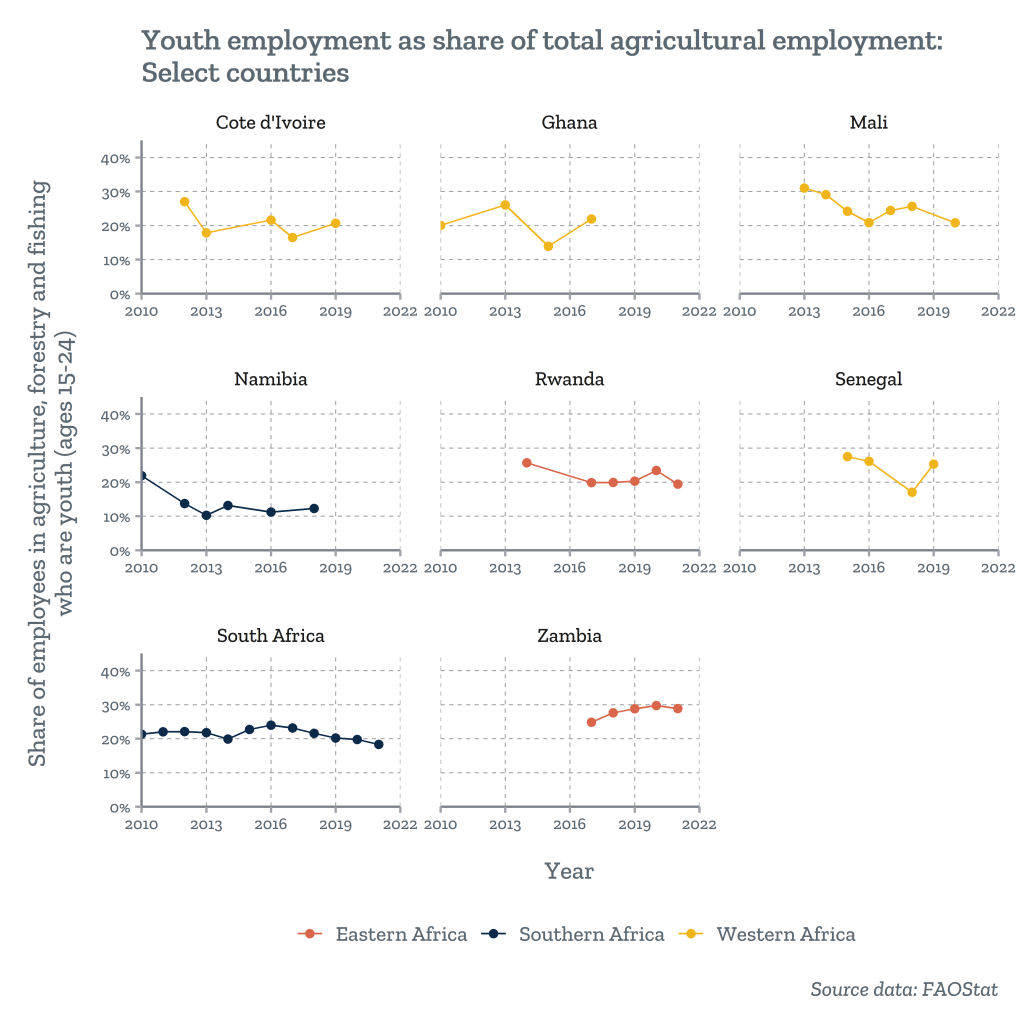
- In the countries shown, the share of agricultural employment held by youth (ages 15-24) has remained mostly constant over time, with some year-to-year fluctuations.
- The share of agricultural employment held by youth is lowest in Namibia and highest in Zambia.
- Note: countries with at least 4 data points between 2010 and 2022 were selected for this data visualization.
Additional info
The figure shows the share of agricultural employment held by youth (ages 15-24) between 2010 and 2022 in the eight sub-Saharan African countries for which at least 4 data points were available during these reference years. No clear relationship is evident between the share of agricultural employment held by youth and factors like sub-region, GDP per capita, or the size of the agriculture workforce in these countries, although the quality and availability of country-level employment data is extremely limited. What is clear is that in most countries, the share of youth in the agricultural workforce has remained relatively constant over time, fluctuating from year-to-year but without trending in a clear direction in most countries.

- For the majority of countries reporting data on youth unemployment, over 10% of youth are unemployed or not in vocational training.
- The pattern applies across sub-regions, with South Africa and several countries in Eastern and Western Africa having the highest rates of youth unemployment.
- In many countries, a higher percentage of urban youth compared to rural youth are unemployed or not in vocational training.
Additional info
The prevalence of youth not in employment or vocational training (NEET) is a critical outcome related to how effective agri-food systems are at creating decent job opportunities and economic wellbeing for young people.
Among countries in sub-Saharan Africa that report data on youth unemployment and vocational training, the majority of countries report that at least 10% of youth do not have jobs and are not in any vocational training. In most countries, urban youth have slightly higher unemployment rates compared to rural youth However, South Africa, Senegal, and Mali all have a large portion of rural youth who are not able to find employment or any vocational training opportunities. NEET prevalence is only loosely correlated with a country’s GDP per capita.
These data demonstrate that there are large portions of urban and rural youth populations that are potentially ready to engage in AFS employment, provided adequate investment in creating youth opportunities.

- Kenya was the only country in sub-Saharan Africa where the majority of people, both youth (ages 15-14) and adults (ages 25+), utilized a mobile phone or the internet to send or receive money in 2017.
- In every sub-Saharan African country besides Kenya, Namibia, Gabon, and Uganda, less than 40% of youth utilized internet payments in 2017.
- Close to 0% of the youth populations of the Central African Republic, South Sudan, and Ethiopia utilized internet payments in 2017.
Additional info
Since it was first introduced nearly 20 years ago, mobile money has become one of the most important technologies in building a more inclusive and connected economy in sub-Saharan Africa. Mobile money enables people to pay for products and services, or to receive payments remotely, as long as they have a cell phone account.
Mobile money/internet payment utilization varies widely across sub-Saharan Africa, from nearly 70% in Kenya to nearly 0% in South Sudan in 2017. Similarly, the size and the direction of the utilization gap between youth (ages 15-24) and adults (25+) varies. In some countries, internet payment utilization was higher among adults than youth; this gap was largest in Zimbabwe, Senegal, and Cote d’Ivoire. In other countries, utilization was higher among youth than adults; this gap was largest in Mozambique and Mauritius.
Mobile money use is a heuristic for connectedness along value chains and readiness for innovation. For example, an agro-processing entrepreneur in a country with a high rate of mobile money penetration will be able to work with farmers fairly easily to establish a secure supply of crops for a new product. Comparatively, a similar entrepreneur in a country with low mobile money penetration will need to establish a cash-based business in order to develop a new line of business. Thus, countries where mobile money/internet payment utilization is high may provide an enabling environment for young people seeking employment and striving to innovate within agri-food systems.
SCENARIOS FOR FUTURE AGRI-FOOD SYSTEM PATHWAYS
Using data to explore agri-food system dynamics and implications for youth
Introduction
Agri-food systems (AFS) provide significant livelihood opportunities for African youth. However, the future of decent work for youth faces uncertainties stemming from climate change, economic growth, globalization, concentration of power and resources, rapid technological advances, and an increasingly unstable geopolitical environment. Furthermore, Africa’s youth population is projected to double by 2030, with a significant proportion still living in rural areas despite rising urbanization rates. This means that for many African countries, there is a challenge to create decent work opportunities for youth in agri-food systems while also promoting wider rural and peri-urban economic development. Agri-food systems transformations will have implications for youth opportunities and rural economic development. It is critical, therefore, to understand key opportunities and risks for generating inclusive and quality jobs for youth across agri-food systems over the coming decades.


An AFS approach looks beyond the food value chain; it encompasses the outcomes of all activities in the agri-food system, including poverty reduction, decent jobs, social welfare, a clean environment, and food security. To transform today’s agri-food systems into healthier, more equitable, resilient and sustainable systems with inclusive, equitable and decent work for youth, it is necessary to understand them better, including their drivers of change. Food systems are complex and dynamic and often evolve in unpredictable ways. Components co-evolve over time, becoming mutually supportive, keeping current production and consumption patterns established and deeply embedded. They are also self-organized, with actors maintaining, defending or incrementally improving the existing system according to their own interests. Actors also operate within the current overall institutional and business environment, and their evolution is subject to influence from powerful actors with vested interests. However, actors in the food system can coordinate with each other to shape the system – moving towards sustainable outcomes in the face of resistance to change. The agri-food system, as explored in this website, is illustrated below.
About this website
With support from the Mastercard Foundation, Foresight4Food partnered with Mathematica to analyze and visualize secondary data sources to shed light on drivers, system functions, and outcomes of agri-food systems. This website represents a compilation of data visualizations that provide insights into how national, regional, and global trends may affect how agri-food systems function, to uncover important implications for the future of youth employment in the sector. A brief bulleted explanation accompanies each visualization, with further insights on connections to the AFS and youth employment displayed by clicking “Additional info.”

Content is organized under four headings:
- RESEARCH QUESTIONS
- Core challenge: What will be the (rural) youth employment demands over the coming decades?
- Context 1: How are employment patterns across different sectors in Africa’s economies likely to change given different trajectories of economic development?
- Context 2: Agri-Food Systems: What are the likely mega trends and uncertainties for Africa’s agri-food systems by 2050, and what are the implications for employment?
- AGRI-FOOD SYSTEM
- KEY TRENDS AMONG YOUTH IN SUB-SAHARAN AFRICA
- SCENARIOS FOR FUTURE AGRI-FOOD SYSTEM PATHWAYS
- REFERENCES
A note on using secondary data for foresight
There are risks associated with using national-level secondary datasets to investigate agri-food systems. For example, such datasets may omit societal groups that are considered more difficult to accurately survey, such as indigenous groups or highly rural communities who are hard to reach or who speak languages/dialects unfamiliar to survey enumerators. Additionally, datasets that are compiled across many countries may obscure important cultural and geographic differences. Lastly, many datasets are not disaggregated by age, presenting challenges to distilling insights specific to youth opportunities within agri-food systems. It is important to consider the biases and assumptions that may be underlying the data, and to allow space for other possible narratives about agri-food systems besides those presented in the data visualizations on this website.
RESEARCH QUESTIONS
Core Challenge: What will be the rural youth employment demands over the coming decades?

- The 18-35 youth population in sub-Saharan Africa has been steadily growing since 1980 and is projected to rise rapidly to reach levels similar to those of South Asia – at approximately 650 million people – by 2050.
- In contrast, East Asia’s youth population is expected to shrink, even under a high fertility scenario, while growth in Latin America and the Caribbean’s youth population will be flat in coming decades.
Additional info
Over the coming decades, the population of youths (18-35-year-olds) in sub-Saharan Africa is expected to grow exponentially. By the year 2050, it is expected that there will be between 600-650 million youths in the region – rivaling the plateauing youth population in South Asia and dwarfing East Asia and Latin America.
This rapid growth among the youth population in sub -Saharan represents a challenge and opportunity for agri-food systems and employment. This expected trajectory in the youth population may lead to transformation of agri-food systems and sub-Saharan economies more broadly. Hundreds of millions more young people looking for work represents massive growth in the labor pool for new ventures as agri-food systems grow and transform. Additionally, with dramatic increases in the number of young people consuming food, farmers and food processors will seek to meet demand through innovation and entrepreneurship.
Growth in employment in agri-food systems will ultimately depend on where youth live relative to centers of agricultural production and processing. The figures below represent a demographic shift in terms of the rural/urban divide.


- The youth population is expected to grow and urbanize at different rates across regions in sub-Saharan Africa.
- Eastern and Western Africa are expected to see the largest growth in youth populations by 2050.
- The majority of youth in Southern Africa, Western Africa, and Central Africa will live in urban areas by 2050.
Additional info
Youth demand for AFS employment will be highly influenced by the spatial distribution of youth. According to Shared Socioeconomic Pathways (SSP) projections models produced for the Intergovernmental Panel on Climate Change (IPCC), most regions within sub-Saharan Africa will have a primarily urban youth population. By 2050, the urban share of Eastern African youth is anticipated to reach 45%.
Overall, the largest growth in youth population will be in Eastern and Western Africa, while Central Africa will see modest growth and Southern Africa will remain flat. These regions will differ in expected spatial distribution of youth. By 2050, the majority of youth in Western, Central, and South Africa will live in cities, while a small and narrowing majority of Eastern African youth will continue to reside in rural areas as they do today.
The implication of this trend is that more Eastern African youth will seek AFS employment in agriculture or other rural-centered food jobs such as aggregation and transportation, given that these sectors are concentrated in rural areas. The more highly urbanized youth in Western, Central, and Southern Africa may be more likely to find AFS employment in food manufacturing, distribution, and service industry jobs.
The population growth and urbanization models represented in these figures are based on an SSP-2 scenario, which assumes moderate challenges to climate change adaptation and mitigation . Adaptation refers to actions taken to improve resilience to the effects of climate change (e.g., planting mangroves in coastal areas), while mitigation refers to actions taken to reduce contributions to climate change (e.g., curbing greenhouse gas emissions). Moderate challenges to adaptation and mitigation implies political or economic barriers to taking action at the national-, regional-, or global-levels.
Context 1: How are employment patterns across different sectors in Africa’s economies likely to change given different trajectories of economic development?


- Between 1990 and 2021, the share of GDP in sub-Saharan African economies represented by agricultural value-add reduced from approximately 30% to 21%.
- East African economies are more dominated by agricultural value-add compared to other regions, while Southern Africa has consistently had a smaller agricultural sector.
- At the same time as agriculture’s share of GDP has been dropping, agricultural share of total employment has also dropped across sub-Saharan Africa.
- Similar to GDP, agricultural share of employment is highest in Eastern, Central, and Western Africa.
Additional info
The role that agricultural value-add plays in driving economic productivity and growth carries implications for AFS employment patterns. As these figures demonstrate, agricultural value-add is playing a decreasingly important role in sub-Saharan African economies now compared to 1990. Simultaneously, agricultural share of employment has decreased across all sub-regions.
There are regional differences in the importance of agriculture in economic productivity and employment patterns. Over this 30-year period, agriculture has played a small but relatively stable role in overall GDP and labor markets in Southern Africa compared to other regions, with less than 10% of GDP and 20% of jobs coming from the agricultural sector. In contrast, from 1990 to today, agriculture’s role as a driver of economic growth and employment in Eastern Africa has shifted considerably, with share of GDP dropping from over 40% to 25%, and with share of employment dropping from over 70% to over 60%. Now, with the exception of Southern Africa as a low outlier, agricultural value-add represents 21% of GDP for most sub-Saharan African economies as a whole, compared to over 30% in 1990.
It is important to note that the decrease in agricultural share of GDP and employment does not necessarily mean that AFS jobs are disappearing, but it does mean that as economies diversify, youth are likely to have a growing number of employment opportunities outside the AFS.


- Lines represent year-on-year pathways for each country between 2010-2019, with arrows representing the direction of the trend over the time period.
- A decade of observations of economic growth and agricultural share of employment show that as national economies grow (moving to the right on the horizontal axis), even modestly, agricultural share of GDP tends to decrease and agricultural jobs represent a smaller slice of employment.
- This trend appears to be consistent across sub-regions — Eastern Africa has a low GDP per capita, large agricultural share of GDP, and large relative agricultural workforce; Southern African economies have a larger GDP, smaller share of GDP represented by agricultural value-add, and small relative agricultural workforce.
Additional info
These figures display a prevailing country-level pattern of “structural transformation,” that as economies grow, agricultural share of GDP and total employment in the sector decreases.
This effect is highly clustered at the level of sub-regions. Southern Africa has had high economic growth, with agricultural GDP representing a small portion of total real GDP. West African countries have had moderately large economic growth in recent years with agricultural value-add playing a decreasingly important economic role, resulting in a lower share of agriculture among total employment. Despite the importance of agricultural value-add for GDP and employment in Eastern Africa, economic growth outside the agricultural sector has led to a reduction in the share of jobs. Lastly, even countries in Central Africa, which have not uniformly experienced economic growth between 2010-2019 (i.e., several countries exhibit a leftward trend indicating a decline in real GDP per capita), experienced a reduction in agricultural share of employment over the same period.

- Across countries that report youth employment by AFS segment, typically rural-based AFS jobs such as agricultural and fisheries production represent the largest share of employment among 15-24-year-olds, the age range the International Labor Organization (ILO) uses to define the youth population.
- More urban-based jobs, such as agro-processing, retail, hotels and food service, and storage, employ smaller percentages of youth.
- As youth urbanization continues, demand for more urban AFS jobs will likely expand.
Additional info
It is difficult to discern clear longitudinal patterns in youth employment in AFS due to patchiness in reporting; most countries in sub-Saharan Africa do not regularly report employment data disaggregated by AFS sector, age group, or by urban/rural areas. Nonetheless, the available data demonstrate the of jobs in agricultural production among youth across many sub-Saharan African economies.
Across all countries that report data for youth employment (defined by the ILO as 15-24), the majority of working youth are employed in agricultural or fisheries production. A notable percentage of youth in some countries work in food service, and an insignificant portion of youth work in agro-processing and retail. Some countries report that a sizable percentage of youth work in storage, a key function in AFS. The data are not disaggregated further to uncover the percentage of youth that are employed in storage specifically related to food systems.
Taken together, the ILO data from recent years demonstrate that even as the agricultural share of overall economic activity has decreased, it remains to be one of the primary ways in which youth have found their way into AFS jobs in recent years.

- In rural and intermediate areas (defined as the least- and second-least dense population density quartiles), a majority of younger youths’ (15-24-year-olds) working hours are spent in agriculture, while substantial portions of older youths’ (24-34-year-olds) working hours are spent on AFS self-employment or non-AFS work.
- In peri-urban areas, agriculture is still an important source of employment for younger youths, while a majority of older youths find employment elsewhere in the AFS or outside it altogether.
- In urban areas, less than 50% of youths’ (15-34-year-olds) working hours are spent in AFS employment.
Additional info
Dolislager et al. (2019) collated data from more than 30,000 households across six countries in Eastern and Western Africa in order to derive the overall share of labor hours worked by people across age groups and geographic settings. The data are from national surveys collected between 2013-2016, meaning that the data represent a snapshot in time for each country. Their findings indicate that across African labor markets, youth participate in a wide array of employment, both within and outside of the AFS, and that there are clear spatial and age-related patterns associated with employment across the AFS. By-and-large, the data indicate that younger and more rural populations are more likely to find employment within agriculture and other AFS segments, while older and more urban populations are more likely to find employment outside the AFS.
Economic development will likely have an outsized effect on these patterns. Previous figures indicate that economic growth in Africa is outstripping growth in the agriculture sector, and agricultural jobs represent a shrinking share of overall labor. In every geographic setting, older youths (25-34-year-olds) are less likely to work in agriculture than younger youths (15-24-year-olds); even in rural settings, 25-34-year-olds spend fewer than 50% of labor hours on agriculture.
Without longitudinal data, it is not possible to examine how youth labor preferences and behaviors respond to broader economic patterns. However, as other figures indicate, agricultural share of employment tends to decrease as economic development increases. Also, it is expected that a higher proportion of youth will live in cities, even though overall population growth means that there will be more rural youth in the future than there are today. Overlaid on this figure, these trends suggest that rural youth may have a harder time finding farmwork due to decreasing economic reliance on the agriculture sector and rural population growth. In urban areas, where youth currently spend less than 50% of labor hours working within the AFS, youth may continue expanding their non-AFS employment.
Context 2: What are the likely mega-trends and uncertainties for Africa’s agri-food systems by 2050, and what are the implications for employment?

- The population of sub-Saharan Africa, currently only about 80% that of China and India, is expected to increase exponentially over the coming decades.
- By 2050, over 2.1 billion people will live in sub-Saharan Africa, which is larger than the population of both China and India as well as Europe, Latin America, and the U.S.
- Total population growth is a mega-trend that affects many aspects of agri-food systems.
Additional info
Population growth trends will play an outsized role in agri-food systems – not only do population dynamics shape labor markets and food consumption trends, but the population of sub-Saharan Africa is expected to change rapidly by 2050, which has the potential to cause large-scale changes across the AFS.
This figure represents historic trends and forward-looking medium-fertility population projections from the UN Population Prospects dataset. While most other global regions of note have seen populations plateau over the past 20 years, sub-Saharan Africa has been on a constant upward trajectory. The current population of the region is over 1 billion people and is expected to nearly double to just over 2 billion by 2050. Comparatively, China and India’s population growth is expected to plateau, and eventually begin declining beyond 2050. Latin America and the United States expect modest growth by 2050, and Europe is projected to experience mild population contraction.
As other figures illustrate, sub-regions within sub-Saharan Africa will differ in the rate at which urban and rural populations will grow, as growth patterns are affected by both present and future conditions. These uncertainties make it difficult to predict precisely how sub-Saharan Africa’s explosive population growth will affect the AFS. However, taken together, the projections here suggest that sub-Saharan Africa will be the most populous region in the world by 2050. This growing population’s demand for food and available labor for AFS jobs brings the potential to transform how AFS function both within sub-Saharan Africa, as well as within other regions with extensive trade ties to sub-Saharan Africa.

- Since 2000, total agricultural production value has risen dramatically in Eastern and Western Africa and has risen gradually in Central and Southern Africa.
- Western Africa has the highest regional agricultural production value of all sub-Saharan Africa sub-regions, at over $125 billion in 2020.
- For Eastern, Western, and Central Africa, agricultural production value has been primarily driven by vegetables, fruits, and nuts. In Southern Africa, however, animal products represent the greatest share of production value.
Additional info
Agricultural production value is an important indicator of the overall productivity of the agriculture sector and can provide an understanding of the geographies and types of products that are driving agricultural growth. While agricultural production value is highest in Western Africa, production value has more than doubled in Eastern Africa since 2000. Central Africa experienced modest growth over the same period and Southern Africa has exhibited little growth since 2000.
Fruit, vegetable, and nut production has driven growth in agricultural production value over the past 20 years and constitutes the dominant share of production value in sub-Saharan Africa. However, animal products represent a substantial share of production value in Eastern Africa and Southern Africa. Cereals are also a notable portion of overall production value in Eastern and Western Africa. Cash crops contribute a small share, which has steadily declined over 2000-2020 as overall production value has increased.
These trends in agricultural production value demonstrate that Eastern and Western Africa are continuing to see large growth in their agriculture sectors, while Central and Southern Africa are experiencing some stagnation. These trends are likely to have implication for the abundance of AFS employment opportunities in each region over the next 30 years.

- Land productivity varies across crop categories, with cash crops having the highest productivity, followed by vegetables, fruit and nuts. Southern Africa has the highest land productivity for these two categories.
- Land productivity for pulses and cereals have increased over the years in Eastern and Western Africa, while Central Africa has seen virtually no increases in crop productivity across all crop types.
Additional info
Since 2000, land productivity trends, measured as thousands of hectograms of a crop produced per hectare of land, have varied across crop types and sub-regions. Eastern Africa has had large growth in land productivity for pulses and cereals, but has had minor growth in productivity for vegetables, fruits, and nuts, and a decline in productivity for cash crops. Southern Africa has had growth in productivity for cereals and vegetables, fruit and nuts, but has had stagnation in land productivity in pulses and cash crops. Western Africa has had large growth in productivity for pulses, has had small growth for cereals and vegetables, and has remained stable for cash crop. Crop productivity in Central Africa has been stagnant across all crop categories.
Notably, Southern Africa has significantly higher land productivity for vegetables, fruits and nuts, as well as cash crops, compared to other sub-regions. The only crop types for which there was growth in land productivity across multiple sub-regions were cereals and pulses, though only Eastern and Western Africa improved land productivity in pulses.
Land productivity is an indicator of whether farms will be able to feed the growing population without having to convert large amounts of undeveloped land into farms. Growth in cereal and pulse land productivity is an indication that sub-Saharan African farms may be able to meet demand. However, economic growth may also mean changing diets, which may lead to shifts away from cereal- and pulse-heavy farming. Meanwhile, stagnation in land productivity for vegetables, fruits, and nuts, and cash crops could indicate limits on how much value sub-Saharan African farms can produce for export markets. Stagnating crop productivity per unit of land could mean that farms may expand, which could mean growth in agricultural jobs. Alternatively, more efficient farming practices could mean that farms will grow at a slower pace, meaning the same number of agricultural jobs for a larger future population.

- Large scale land transactions are sales or concessions of land parcels greater than 200 hectares in size for a variety of purposes, including large-scale agriculture, resource extraction, or conservation.
- Ethiopia and Mozambique are the two countries with the highest frequency of transacting large parcels of land for agriculture, with 79 and 42 recorded transactions above 200 hectares, respectively.
- With over 3% of total land transacted for large-scale agriculture, Liberia, São Tomé and Principe, and Gabon have made some of the most major land transactions relative to country size in sub-Saharan Africa.
- Large scale land transactions are often misreported to shield buyers from scrutiny, so these numbers represent a minimum, and true values may be higher.
Additional info
Recent decades have seen land consolidation by corporate and foreign state actors for industrial agriculture and natural resource extraction. Large scale land transactions (sales of land parcels greater than 200 hectares) have become increasingly common, particularly in countries known for productive soils and weak land tenure frameworks. Land consolidation is an important trend because of what it represents in terms of the composition of agricultural producers, available cropland, industrialization of agriculture, and the national and regional agricultural policy environment. However, because large scale land transactions can be controversial due to displacement of smallholder farmers or contributions to deforestation, it can be difficult to assess the full scale of land aggregation.
Based on data from the Land Matrix, it is apparent that a small handful of countries in Eastern, Western, and Central Africa have conducted the bulk of land transactions. Ethiopia and Mozambique have in sum conducted over 80 known land transactions for parcels that were 1,000 hectares or greater. Known large scale land transactions account for 1% of national land area or more in six countries in sub-Saharan Africa; Liberia, São Tomé and Principe, and Gabon are outliers with over 3% of national land held by corporate or foreign government actors for industrial agriculture.
The rate and scale of these transactions demonstrates that many countries in sub-Saharan Africa are engaging in land management practices that are intended to support industrial agricultural developments, potentially at a cost to small-scale farmers. These developments carry implications for AFS employment, since many industrial agricultural developments state an intention to create rural jobs, but these jobs will likely be affected by the future availability of technologies that improve efficiency in industrial agriculture.

- Maize yields in West, Central, and East Africa are projected to be more negatively impacted by climate change than Southern Africa.
- In particular, Senegal, Gambia, Cote d’Ivoire, Egypt, Sudan, and southern DRC are projected to experience the most severe climate change impacts on maize yields.
- On the other hand, Southern Africa, northern Kenya, and Eritrea are projected to experience positive impacts on maize yield from climate change.
- Wheat yields are projected to be positively impacted by climate change in Eastern and Southern Africa, while those in eastern Sudan and northern Nigeria will be negatively affected.
Additional info
Climate change is a major uncertainty in the future of crop productivity, and thus agri-food systems broadly. While the Intergovernmental Panel on Climate Change (IPCC) has identified various scenarios for average global warming above pre-industrial levels, it is more difficult to predict exactly how crops will react to warming scenarios, because it is difficult to determine whether climate change resistant seed varieties and farming practices will be broadly adopted.
The IPCC’s 2022 report on impacts, adaptation, and vulnerability stated that in a scenario in which global average temperatures increase between 2.4-4.4°C or more above pre-industrial levels by 2100, yields are expected to change dramatically in 2069-2099 compared to yields in 1986-2013. In this figure, brown shows yield reductions and teal shows yield improvements. Maize yields are projected to reduce sharply across Western and Central Africa (shown in brown), and large swaths of Eastern Africa compared to average yields for 1986-2013. Simultaneously, Southern Africa and some areas of Eastern Africa are expected to see a rise in maize productivity (shown in turquoise). Wheat, a less-commonly farmed crop, is expected to fare better under this climate change scenario, with yields expecting to rise across large areas in Eastern and Southern Africa compared to recent average yields.

- Western and Eastern Africa report the largest value of cash crop exports from sub-Saharan Africa. Those two sub-regions, along with Southern Africa, report the lion’s share of non-cash crop exports.
- In contrast, Central Africa accounts for very little of the export value from sub-Saharan Africa.
- Between 2000 and 2020, the value of cash crop exports increased threefold and the value of non-cash crop exports increased fivefold and continues to rise.
- “Other agricultural products” include animal products, processed and unprocessed cereals, vegetables, fruits, and nuts, pulses, vegetable oils, and other products which are not cash crops.
Additional info
In 2000, the value of cash crop exports from all of sub-Saharan Africa was below $5 billion annually. In 2021, Eastern Africa exported approximately $5 billion and Western Africa exported nearly $10 billion in cash crops. This aligns with the popular understanding of where cash crops – such as cocoa, coffee, and vanilla – are grown on the continent. Central and Southern Africa have seen slight increases in cash crop exports between 2000 and today, but these increases are minimal compared to the massive growth seen in Eastern and Western Africa and represent only about $1 billion or less per year.
The value of non-cash crop exports has increased to an even greater degree than cash crop exports since 2000. In 2000, the value of non-cash crop exports was less than $5 billion combined across sub-regions; in 2021, Eastern, Western, and Southern Africa exported a combined $25 billion in non-cash crop agricultural products. Meanwhile, Central Africa non-cash crop exports have barely changed.
This growth in the value of agricultural exports indicates that Eastern, Western, and Southern Africa are increasingly interacting with and supplying goods to global agri-food systems. Demand for African cash crops and other agricultural exports may drive AFS labor in terms of which crops need to be grown or which value-added products must be produced for export.

- The largest share of intra-African trade take place between countries in the same region – for example, from one country in Southern Africa to another country in Southern Africa.
- Trade within and between regions has increased steadily over time.
- The most commonly traded items are processed agricultural products, animal products, and other processed goods.
Additional info
Linkages between neighboring countries and sub-regions in sub-Saharan Africa has the potential to influence agricultural production, as well as employment in other sectors of the AFS focused on packaging and transporting products for intra-continental trade. Between 2000 and 2023, there has overall been a steady increase in intra-African trade, with some variation along the way. One hallmark of intra-African trade is that most trade occurs between countries in the same region.
Since 2000, East African countries have steadily increased exports to other countries in the sub-region, as well as countries in Central Africa. While Eastern African countries exported to Southern Africa countries through the early 2010s, the value of exports has decreased over the years. Southern African countries have increased exports to Eastern Africa steadily over the last 20 years, and intra-Southern Africa trade experienced a large spike between 2010 and 2015. Western African countries trade primarily with other Western African countries and have little interaction with countries in other regions. Lastly, Central African countries trade very little with other African countries, including within the region.
Countries tend to trade a variety of crops and other agricultural products with one another, indicating that African agri-food systems are becoming increasingly linked across all areas of agricultural production. The “other” category represents value-added agricultural products, livestock feed, and other by-products from agricultural manufacturing and animal processing.

- Through much of the last two decades, countries in sub-Saharan Africa have been net exporters, though in recent years, Eastern, Central, and Western Africa have become net importers.
- Besides a dip into net import status in the early 2010s, Southern Africa is a net exporter.
- Western Africa has the most negative trade balance of sub-regions within sub-Saharan Africa, followed by Central Africa.
Additional info
Agricultural trade balance is an important indicator of whether domestic agrifood systems are set up to deliver in-demand products to their populations or whether their agricultural products are in-demand by the rest of the world. Net exporters produce products that are highly in-demand, while net importers rely on goods that other countries produce.
Net import and export status varies by sub-region across sub-Saharan Africa. For most years between 2000 and 2021, Southern Africa and Eastern Africa have been net exporters. However, the two sub-regions have been diverging in recent years, as Southern Africa has exported greater trade value, while Eastern Africa has veered into net importer territory. Western Africa has fluctuated widely between net importer and exporter status. Central Africa has been a net importer consistently over the past two decades.
As Sub-Saharan economies develop further and food consumption patterns change, trade balances may change if countries develop economies of scale and policy frameworks that enable and incentivize domestic production of in-demand goods. For now, as long as it is cheaper to import goods rather than produce them domestically, countries will remain net importers.

- Across African countries surveyed, urban areas have higher mobile money account ownership. Within countries, this difference is often 10 percentage points or more.
- There are not consistent differences between youth (15-24) and non-youth (25+) across reporting countries; in some, youth are more likely to possess a mobile money account, and in other countries are less likely.
- Excluding Kenya, the overall percentage of mobile money account ownership among youth is low.
Additional info
Since it was first introduced nearly 20 years ago, mobile money has become one of the most important technologies in building a more inclusive and connected economy in sub-Saharan Africa. Mobile money enables people with a cell phone to pay for products and services or to receive payments remotely.
Among 15-24-year-olds, mobile money account ownership has increased from between 5-20% in 2014 to between 20-30% in 2021. For people aged 25-years-old and above, membership has grown from between 5-25% in 2014 to up to 40% in 2021. However, mobile money account ownership tends to be highly stratified by urban/rural setting. In many countries, the gap between the percentage of urban and rural households with at least one mobile money accounts is 10% or higher. However, in Kenya, Uganda, Ghana, and Zimbabwe, ownership among rural households is higher than among urban residents in most other countries.
Mobile money accounts are a heuristic for connectedness along value chains and readiness for innovation. For example, an agro-processing entrepreneur in a country with a high rate of mobile money penetration will be able to work with farmers fairly easily to establish a secure supply of crops for a new product. Comparatively, a similar entrepreneur in a country with low mobile money ownership will need to establish a cash-based business in order to develop a new line of business.

- Southern Africa had the highest fixed broadband subscription rate in 2022, growing consistently since 2005 but still low at 3 per 100 people.
- Other sub-regions in sub-Saharan Africa have experienced limited growth in fixed broadband subscriptions, with sub-regional averages each at fewer than 1 subscriber per 100 people.
Additional info
Similar to mobile money accounts, internet access is an important indicator of economic connectedness. Higher rates of internet connections indicate greater access to information, which may translate to agri-food systems transformations vis-à-vis greater educational and economic opportunities, and growth. Additionally, many innovations for precision agriculture and higher-tech agro-processing rely on internet-based technologies.
Across sub-Saharan Africa, broadband subscriptions are low compared to the global average. Broadband access is highest in Southern Africa, at approximately three subscriptions per 100 people. Eastern, Central, and Western Africa are all below one subscription per 100 people, though this has been trending upward in the past decade. This trend indicates that technological transformations of agri-food systems are not becoming rapidly wide-spread, even as mobile-based technologies such as mobile money are transforming entrepreneurship.

- Food supply has remained relatively constant at the subregion-level from 2010 to present
- Over this period, Eastern Africa has had the lowest overall average food supply (~2,500 g/capita/day) while Central and Western Africa’s food supply neared 3,500 g/capita/day.
- Southern Africa had the highest per-capita supply of animal products, while Central and Western Africa had the highest per-capita supply of vegetable oil and vegetables, fruits, and nuts.
Additional info
Food supply is defined as the amount of food available for consumption by people on an annual basis and is calculated by adding food produced with food imported, and subtracting food exported. Because reliable annual and national-level records of food consumption are not often available, food supply is an important indicator of potential food consumption patterns. Food supply also relates to economic growth; high income county populations tend to consume more animal products and processed foods.
Between the years 2010 and 2020, food supply patterns across sub-Saharan Africa were relatively stable. By the end of the decade, Central and Southern Africa had a slight reduction in overall food consumed, while Eastern Africa had a slight uptick of overall food supply. Central and Western Africa have similar food supply profiles – in both sub-regions, the largest share of food supply comes from fruits, vegetables, and nuts, with cereals and vegetable oil playing important roles as well. Eastern Africa, on the other hand, had an even split between cereals and vegetables, fruit, and nuts, with animal products and vegetable oil representing smaller but important portions of food supply. In contrast, Southern African countries’ food supply is primarily made up of cereals and animal products, with a smaller portion coming from vegetables, fruits, and nuts and vegetable oil.

- Over the past 30 years, Southern Africa has consistently had threefold to fourfold the GDP per capita levels of other sub-Saharan subregions.
- Outside of Southern Africa, growth in real GDP per capita has been tepid – levels in Central Africa in 2020 were roughly equal to levels in 1990. Eastern and Western Africa saw increases of roughly ~$1,300 over the 30 years.
Additional info
Overall economic growth is a significant uncertainty for agri-food system development. As economies grow and diversify, agriculture tends to contribute a smaller share to overall economic output, and niches may open for agri-food system entrepreneurs to innovate in other segments of the agri-food system. Additionally, growth in GDP per capita means the development of a middle class with more disposable income and different tastes in food products compared to traditional home-cooked foods.
Aside from countries in Southern Africa, sub-Saharan Africa has experienced tepid growth over the past 30 years. Western Africa’s GDP per capita has increased from approximately $2,500 to approximately $4,500. Central African countries’ GDP per capita has fluctuated around $5,000, and Eastern African countries’ GDP per capita has increased from less than $1,000 in 1990 to nearly $2,500 by 2020.
This pattern in economic development suggests that the middle class is slowly emerging in most regions of sub-Saharan Africa. While emergence of the middle class means there may more interest in new food types (e.g., processed foods), the slow rate of growth could mean that it will take time for economies of scale to develop to enable widescale domestic production.

- The relationship between the size of an economy’s agriculture sector and its level of wealth is well-established.
- At a GDP per capita level of $4,000 – $5,000, the agriculture (and forestry/fishing) tends to comprise less than 10% of GDP.
- At higher levels of wealth, agriculture’s contribution to the economy (as a percentage) shrinks even further.
Additional info
This figure illustrates the inverse relationship between economic growth and the economic importance of agriculture. In countries where GDP per capita is above $4,000-$5,000, agriculture comprises less than 10% of the overall GDP.
This effect is clustered at the level of sub-regions within sub-Saharan Africa. Southern Africa has had high economic growth, with agricultural GDP representing a small portion. In contrast, Eastern and Western African countries tend to have lower GDP per capita, with agriculture playing a major role in overall GDP.
This trend speaks to the uncertainty of what will happen to the agricultural and food system components of sub-Saharan African economies as they further develop. If they follow the existing trend, agriculture will cease to be an important driver of economic productivity. To what extent will growth take place in other non-agricultural segments of the agri-food system remains to be seen.

- East, Central, and West Africa hold the densest urban populations while also having the lowest GDP per capita.
- Many of Africa’s urban settlements that exceed 300,000 are located on coasts or along key inland waterways.
- In particular, Nigeria has many dense urban areas but a relatively low GDP per capita.
- Northern and Southern Africa have relatively higher GDPs per capita, and large urban populations centered around coastal areas.
Additional info
The spatial distribution of economic productivity relative to urban density is helpful in understanding how urban and rural activities differentially drive economic output. It is often assumed that urban areas contribute more to overall economic activity, but with red circles representing urban centers with more than 300,000 inhabitants and map colors representing spatial distribution of GDP across Africa, it is apparent that this is not always the case, especially in countries that are rich in natural resources and minerals.
The coastal areas of West Africa represent one of the most densely populated regions on the continent, but this area does not appear to have a substantially higher GDP per capita compared to nearby rural areas. In contrast, areas in Southern and Northern Africa have higher GDP per capita relative to the rest of the continent, despite being relatively sparsely populated. The relative lack of difference between urban and rural contributions to GDP per capita demonstrate the importance of agriculture and other rural economic activities to national GDP per capita.
A note on this data visualization is that Equatorial Guinea has been removed from the GDP per capita layer. As a high-income country with a GDP per capita of $28,000, the presence of Equatorial Guinea shifted the distribution of color in the map, making it more difficult to discern differences between other urban and rural GDP per capita in other countries.
Understanding scenario thinking
As illustrated by COVID-19, extreme weather events, volatile food prices and geopolitical instability, turbulence and uncertainty are increasingly the norm. It is impossible to predict the future. However, it is possible to use scenarios to explore different possible ways in which the future might unfold. Scenario thinking can build awareness of future risks and opportunities and enable analysis on how future conditions may enable or constrain the ability to achieve visions for the future. Developing scenarios is also a powerful way of bringing different stakeholders together to explore different assumptions about the future and to create a shared understanding of what other stakeholders would see as more or less desirable futures.
The data visualizations here represent how four potential future scenarios may affect AFS in a variety of ways. The scenarios are described below in-line with the associated data visualizations. Each scenario represents how agri-food system drivers, outcomes, or food system functions may respond to key domains of uncertainty. These do mains, and the related indicators that may shed light on the future of AFS are listed below:
| AFS domain | Indicator |
|---|---|
| Type of food consumption | – Prevalence of undernourishment – Prevalence of obesity |
| Climate resilience | – Total amount of agricultural production |
| Trade | – Value of total trade between countries in sub-Saharan Africa and the rest of the world – Value of agricultural trade between countries in sub-Saharan Africa |
| Scale of broader economic development and employment outside of AFS | – Total GDP per capita – Non-AFS employment |
| Degree of African food self-sufficiency | – Prevalence of moderate or severe food insecurity in the total population |
| Scale of foreign and corporate influence in AFS | – Sum of land sold to foreign interests via large-scale land transactions |

- In this scenario, many African governments respond to an increasingly turbulent global context beset with geopolitical tensions and struggling international institutions by adopting innovative policies to support local food systems and their connection with urban areas.
Additional info
The difficult global context constrains Africa’s wider economic development, and the agri-food systems remains a key employment sector. In this context, a new generation of younger politicians radically rethink Africa’s development trajectory to focus on ensuring sufficient, healthy and reliable food for all. Driven by a highly activist youth contingent and recognizing the risk of social instability, governments develop a highly innovative set of programs to engage youth in transforming agri-food systems. Trade between countries in sub-Saharan Africa increases as local economies become more interdependent, while global exports and other foreign involvement in African agri-food systems reduce. Some progress towards renewable energy is made globally, primarily driven by the private sector, and climate change is being partly controlled; however extreme weather events have a significant impact on agricultural productivity.

- In this scenario, large tech companies, foreign investors and foreign governments seek to, and succeed in, capturing wealth from Africa’s natural resources and large youth workforce. In an increasingly volatile global context marked by growing inequality, climate extremes, and geopolitical instability, there is a scramble for resources and those with wealth seek to protect themselves with high-tech solutions.
Additional info
A small proportion of Africa’s youth who have education and skills can find good jobs in larger firms and high-tech companies, but increasing automation in the food sector means there are limited numbers of such jobs. Governments across the planet fail to create the governance systems needed in an increasingly turbulent world. Weak regulations drive short-term opportunistic markets that exacerbate inequalities and resource degradation. A low-tech agri-food system for poorer consumers functions in parallel to the high-tech system focused on wealthier consumers and exports. As climate change brings extreme weather events, only the high-tech farms are able to increase agricultural production, and these gains go to export markets and wealthier consumers. Without wide-spread economic development, jobs remain low-paying and concentrated in the agri-food system, which exacerbates food insecurity.

- In this scenario, geopolitical turbulence and extreme heat events during the 2020s lead to the setting of a new global compact for the future. Youth become increasingly vocal about the issues. The Ukraine crisis stimulates a rethink of Africa’s food production potential.
Additional info
African governments, supported by international financial institutions and foundations, develop a 15-year plan for Africa to change the agri-food systems investment strategy. Building on early innovation by young African entrepreneurs, a global profile is designed for healthy value-added food from Africa. A global social media campaign inspires the world about young Africans making a difference which evolves into a highly successful marketing strategy for African products. A reformed CGIAR system enables a massive investment in appropriate and accessible climate-smart technology and an enabling environment for the micro-, small, and medium enterprises (MSME) sector, allowing smaller operators to compete with larger scale enterprises. Economically, Africa turns the corner with its growing population, creating demand for industrial products and services. This wider economic growth increases the demand for higher-value food products creating significant opportunities in the sector. Decent work opportunities outside the agri-food systems mean less under-employment and bring increased wages in the agriculture sector. Labor-saving technologies make farming more attractive for young entrepreneurs.

- In this scenario, a lack of investment in climate resilience and an unregulated food sector driven by short-term profits leads to worsening agri-food system outcomes for people and planet across agri-food systems in sub-Saharan Africa.
Additional info
Increasingly frequent extreme weather events, driven by climate change and the absence of a coordinated adaptation program, lead to yield reductions and disease outbreaks. As a result, farmers seek short-term gains, which degrade natural resources further. Food prices are high and fluctuate as climate extreme weather events wreak havoc on food production. The agri-food sector markets cheap, high-energy, low-nutrient foods which poorer groups are forced to consume due to increasing inequality amid a lack of broader economic growth. These factors combine to create an escalating triple burden of undernourishment, obesity, and nutrient deficiency. The lack of wider economic opportunities means that many youth try to make what living they can out of the agri-food systems, which are struggling to meet the demands of an African population which has doubled. The poor economic environment leads to increasingly common exploitation with low wages, along with higher rates of migration, corruption, violence, and social instability. In response, country governments resort to draconian measures to maintain political stability and foreign investors shy away from further investments in agri-food systems in the region.
References
See references list
- Dolislager, M.; Reardon, T.; Arslan, A.; Fox, L.; Liverpool-Tasie, S.; Sauer, C.; and Tschirley, D. 2019. “Youth agrifood system employment in developing countries: a gender-differentiated spatial approach.” IFAD research Series 43. Available at: https://www.ifad.org/en/web/knowledge/-/publication/research-series-issue-43-youth-agrifood-system-employment-in-developing-countries-a-gender-differentiated-spatial-approach
- Figure 5.3 in Giller, K. E.; Andersson, J.; Delaune, T.; Silva, J. V.; Descheemaeker, K.; van de Ven, G.; Schut, A. G. T.; van Wijk, M.; Hammond, J.; Hochman, Z.; Taulya, G.; Chikowo, R.; Narayanan, S.; Kishore, A.; Bresciani, F.; Mancini Teixeira, H.; and van Ittersum, M. 2022. “The future of farming: who will produce our food?” IFAD Research Series 83. Available at: https://www.ifad.org/en/web/knowledge/-/research-series-83-the-future-of-farming-who-will-produce-our-food-
- Figure 9.22 in Trisos, C.H.; Adelekan, I.O.; Totin, E.; Ayanlade, A.; Efitre, J.; Gemeda, A.; Kalaba, K.; Lennard, C.; Masao, C.; Mgaya, Y.; Ngaruiya, G.; Olago, D.; Simpson, N.P.; and Zakieldeen, S. 2022. “Africa”. In: “Climate Change 2022: Impacts, Adaptation and Vulnerability. Contribution of Working Group II to the Sixth Assessment Report of the Intergovernmental Panel on Climate Change [Pörtner, H.-O.; Roberts, D.C.; Tignor, M.; Poloczanska, E.S.; Mintenbeck, K.; Alegría, A.; Craig, M.; Langsdorf, S.; Löschke, S.; Möller, V.; Okem, A.; and Rama, B. (eds.)]”. 1285–1455. Available at: https://doi.org/10.1017/9781009325844.011.
- Figure 22 in Davis, B.; Mane, E.; Gurbuzer, L.Y.; Caivano, G.; Piedrahita, N.; Schneider, K.; Azhar, N.; Benali, M.; Chaudhary, N.; Rivera, R.; Ambikapathi, R.; and Winters, P. 2023. “Estimating global and country-level employment in agrifood systems.” FAO Statistics Working Paper Series, 23-34. Available at: https://doi.org/10.4060/cc4337en
- FAO. 2023a. “FAOStat Employment Indicators: Agriculture.” Available at: https://fenix.fao.org/faostat/internal/en/#data/OEA. Accessed: August 17, 2023.
- FAO. 2023b. “FAOStat Food Balances (2010-).” Available at: https://fenix.fao.org/faostat/internal/en/#data/FBS. Accessed: April 7, 2023.
- FAO. 2023c. “FAOStat Production Indices.” Available at: https://fenix.fao.org/faostat/internal/en/#data/QI. Accessed: May 26, 2023.
- FAO. 2023d. “FAOStat Suite of Food Security Indicators.” Available at: https://fenix.fao.org/faostat/internal/en/#data/FS. Accessed: July 20, 2023.
- FAO. 2023e. “FAOStat Trade Indices.” Available at: https://fenix.fao.org/faostat/internal/en/#data/TI. Accessed: April 8, 2023.
- FAO. 2023f. “FAOStat Value of Agricultural Production.” Available at: https://fenix.fao.org/faostat/internal/en/#data/QV. Accessed: March 15, 2023.
- FAO. 2021. “RuLIS – Rural Livelihoods Information System.” Available at: https://www.fao.org/in-action/rural-livelihoods-dataset-rulis/en. Accessed: April 21, 2023.
- Fricko, Oliver; Havlik, Petr; Rogelj, Joeri; Klimont, Zbigniew; Gusti, Mykola; Johnson, Nils; Kolp, Peter; Strubegger, Manfred; Valin, Hugo; Amann, Markus; Ermolieva, Tatiana; Forsell, Nicklas; Herrero, Mario; Heyes, Chris; Kindermann, Georg; Krey, Volker; McCollum, David L.; Obersteiner, Michael; Pachauri, Shonali; Rao, Shilpa; Schmid, Erwin; Schoepp, Wolfgang; and Riahi, Keywan. 2017. “The marker quantification of the Shared Socioeconomic Pathway 2: A middle-of-the-road scenario for the 21st century.” Global Environmental Change, 42, 251-267. Available at: https://doi.org/10.1016/j.gloenvcha.2016.06.004.
- Fujimori, Shinichiro; Hasegawa, Tomoko; Masui, Toshihiko; Takahashi, Kiyoshi; Herran, Diego Silva; Dai, Hancheng; Hijioka, Yasuaki; and Kainuma, Mikiko. 2017. “SSP3: AIM implementation of Shared Socioeconomic Pathways.” Global Environmental Change, 42, 268-283. https://doi.org/10.1016/j.gloenvcha.2016.06.009.
- ILO. 2023. “ILOStat Youth Labor Market Indicators (YouthSTATS).” Available at: https://ilostat.ilo.org/data/ under the Creative Commons CC BY 4.0 International license. Accessed: April 8, 2023.
- Jaegermeyr, Jonas; Müller, Christoph; Ruane, Alex C.; Elliott, Joshua; Balkovic, Juraj; Castillo, Oscar; Faye, Babacar; Foster, Ian; Folberth, Christian; Franke, James A.; Fuchs, Kathrin; Guarin, Jose; Heinke, Jens; Hoogenboom, Gerrit; Iizumi, Toshichika; Jain, Atul K.; Kelly, David; Khabarov, Nikolay; Lange, Stefan; Lin, Tzu-Shun; Liu, Wenfeng; Mialyk, Oleksandr; Minoli, Sara; Moyer, Elisabeth J.; Okada, Masashi; Phillips, Meridel; Porter, Cheryl; Rabin, Sam; Scheer, Clemens; Schneider, Julia M.; Schyns, Joep F.; Skalsky, Rastislav; Smerald, Andrew; Stella, Tommaso; Stephens, Haynes; Webber, Heidi; Zabel, Florian; and Rosenzweig, Cynthia. 2023a. “Projected changes in global maize production under ssp585”. Available at: https://doi.org/10.48490/3nza-ab60.
- Jaegermeyr, Jonas; Müller, Christoph; Ruane, Alex C.; Elliott, Joshua; Balkovic, Juraj; Castillo, Oscar; Faye, Babacar; Foster, Ian; Folberth, Christian; Franke, James A.; Fuchs, Kathrin; Guarin, Jose; Heinke, Jens; Hoogenboom, Gerrit; Iizumi, Toshichika; Jain, Atul K.; Kelly, David; Khabarov, Nikolay; Lange, Stefan; Lin, Tzu-Shun; Liu, Wenfeng; Mialyk, Oleksandr; Minoli, Sara; Moyer, Elisabeth J.; Okada, Masashi; Phillips, Meridel; Porter, Cheryl; Rabin, Sam; Scheer, Clemens; Schneider, Julia M.; Schyns, Joep F.; Skalsky, Rastislav; Smerald, Andrew; Stella, Tommaso; Stephens, Haynes; Webber, Heidi; Zabel, Florian; and Rosenzweig, Cynthia. 2023b. “Projected changes in global wheat production under ssp585.” Available at: https://doi.org/10.48490/b7qz-6532.
- Samir, KC andWolfgang Lutz. 2017. “The human core of the shared socioeconomic pathways: Population scenarios by age, sex and level of education for all countries to 2100.” Global Environmental Change, 42, Pages 181-192. Available at: https://doi.org/10.1016/j.gloenvcha.2014.06.004.
- Kummu, M.; Taka, M. & Guillaume, J. 2018. “Gridded global datasets for Gross Domestic Product and Human Development Index over 1990–2015.” Scientific Data, 5, 180004. Available at: https://doi.org/10.1038/sdata.2018.4
- Land Matrix Initiative. 2023. “Deals.” Available at: https://landmatrix.org/list/deals/ under the Creative Commons CC BY 4.0 International license. Accessed: June 9, 2023.
- Jiang, Leiwen and Brian C. O’Neill. 2017. “Global urbanization projections for the Shared Socioeconomic Pathways.” Global Environmental Change, 42, 193-199. Available at: https://doi.org/10.1016/j.gloenvcha.2015.03.008.
- Popp, Alexander; Calvin, Katherine; Fujimori, Shinichiro, Havlik, Petr; Humpenöder, Florian; Stehfest, Elke; Bodirsky, Benjamin Leon; Dietrich, Jan Philipp; Doelmann, Jonathan C.; Gusti, Mykola; Hasegawa, Tomoko; Kyle, Page; Obersteiner, Michael; Tabeau, Andrzej; Takahashi, Kiyoshi; Valin, Hugo; Waldhoff, Stephanie; Weindl, Isabelle; Wise, Marshall; Kriegler, Elmar; Lotze-Campen, Hermann; Fricko, Oliver; Riahi, Keywan; and van Vuuren, Detlef P. 2017. “Land-use futures in the shared socio-economic pathways.” Global Environmental Change, 42, 331-345. Available at: https://doi.org/10.1016/j.gloenvcha.2016.10.002.
- Riahi, Keywan; van Vuuren, Detlef P.; Kriegler, Elmar; Edmonds, Jae; O’Neill, Brian C.; Fujimori, Shinichiro; Bauer, Nico; Calvin, Katherine; Dellink, Rob; Fricko, Oliver; Lutz, Wolfgang; Popp, Alexander; Cuaresma, Jesus Crespo; KC, Samir; Leimbach, Marian; Jiang, Leiwen; Kram, Tom; Rao, Shilpa; Emmerling, Johannes; Ebi, Kristie; Hasegawa, Tomoko; Havlík, Petr; Humpenöder, Florian; Da Silva, Lara Aleluia; Smith, Steve; Stehfest, Elke; Bosetti, Valentina; Eom, Jiyong; Gernaat, David; Masui, Toshihiko; Rogelj, Joeri; Strefler, Jessica; Drouet, Laurent; Krey, Volker; Luderer, Gunnar; Harmsen, Mathijs; Takahashi, Kiyoshi; Baumstark, Lavinia; Doelman, Jonathan C.; Kainuma, Mikiko; Klimont, Zbigniew; Marangoni, Giacomo; Lotze-Campen, Hermann; Obersteiner, Michael; Tabeau, Andrzej; and Tavoni, Massimo. 2017. “The Shared Socioeconomic Pathways and their energy, land use, and greenhouse gas emissions implications: An overview.” Global Environmental Change, 42, 153-168. Available at: https://doi.org/10.1016/j.gloenvcha.2016.05.009.
- UN DESA. 2022. “World Population Prospects 2022, Online Edition”. Population Division. Available at: https://population.un.org/wpp/ under the Creative Commons CC BY 3.0 IGO license. Accessed: August 1, 2023.
- UN DESA. 2018. “World Urbanization Prospects: The 2018 Revision, Online Edition.” Population Division. Available at: https://population.un.org/wup/download/. Accessed: May 25, 2023.
- van Vuuren, Detlef P.; Stehfest, Elke; Gernaat, David E.H.J.; Doelman, Jonathan C.; van den Berg, Maarten; Harmsen, Mathijs; de Boer, Harmen Sytze; Bouwman, Lex F.; Daioglou, Vassilis; Edelenbosch, Oreane Y.; Girod, Bastien; Kram, Tom; Lassaletta, Luis; Lucas, Paul L.; van Meijl, Hans; Müller, Christoph; van Ruijven, Bas J.; van der Sluis, Sietske; and Tabeau, Andrzej. 2017. “Energy, land-use and greenhouse gas emissions trajectories under a green growth paradigm.” Global Environmental Change, 42, 237-250. Available at: https://doi.org/10.1016/j.gloenvcha.2016.05.008.
- World Bank. 2023a. “World Development Indicators.” Available at: https://databank.worldbank.org/source/world-development-indicators. Accessed: June 7, 2023.
- World Bank. 2023b. “World Integrated Trade Solution.” Available at: https://wits.worldbank.org/. Accessed: August 23, 2023
- World Bank. 2021. “The Global Findex Database 2021: Financial Inclusion, Digital Payments, and Resilience in the Age of COVID-19.” Available at: https://www.worldbank.org/en/publication/globalfindex. Accessed: May 25, 2023.
- World Resources Institute. 2023. “Global Forest Watch.” Available at: https://www.globalforestwatch.org/. Accessed: May 5, 2023.
